1
2


We all know how much of a resource hog windows/google chrome have become over the years and we all accepted it, because we were told this how modern software works.

And now suddenly as memory prices shot up, these companies are successfully able to optimise their software to reduce memory consumption.

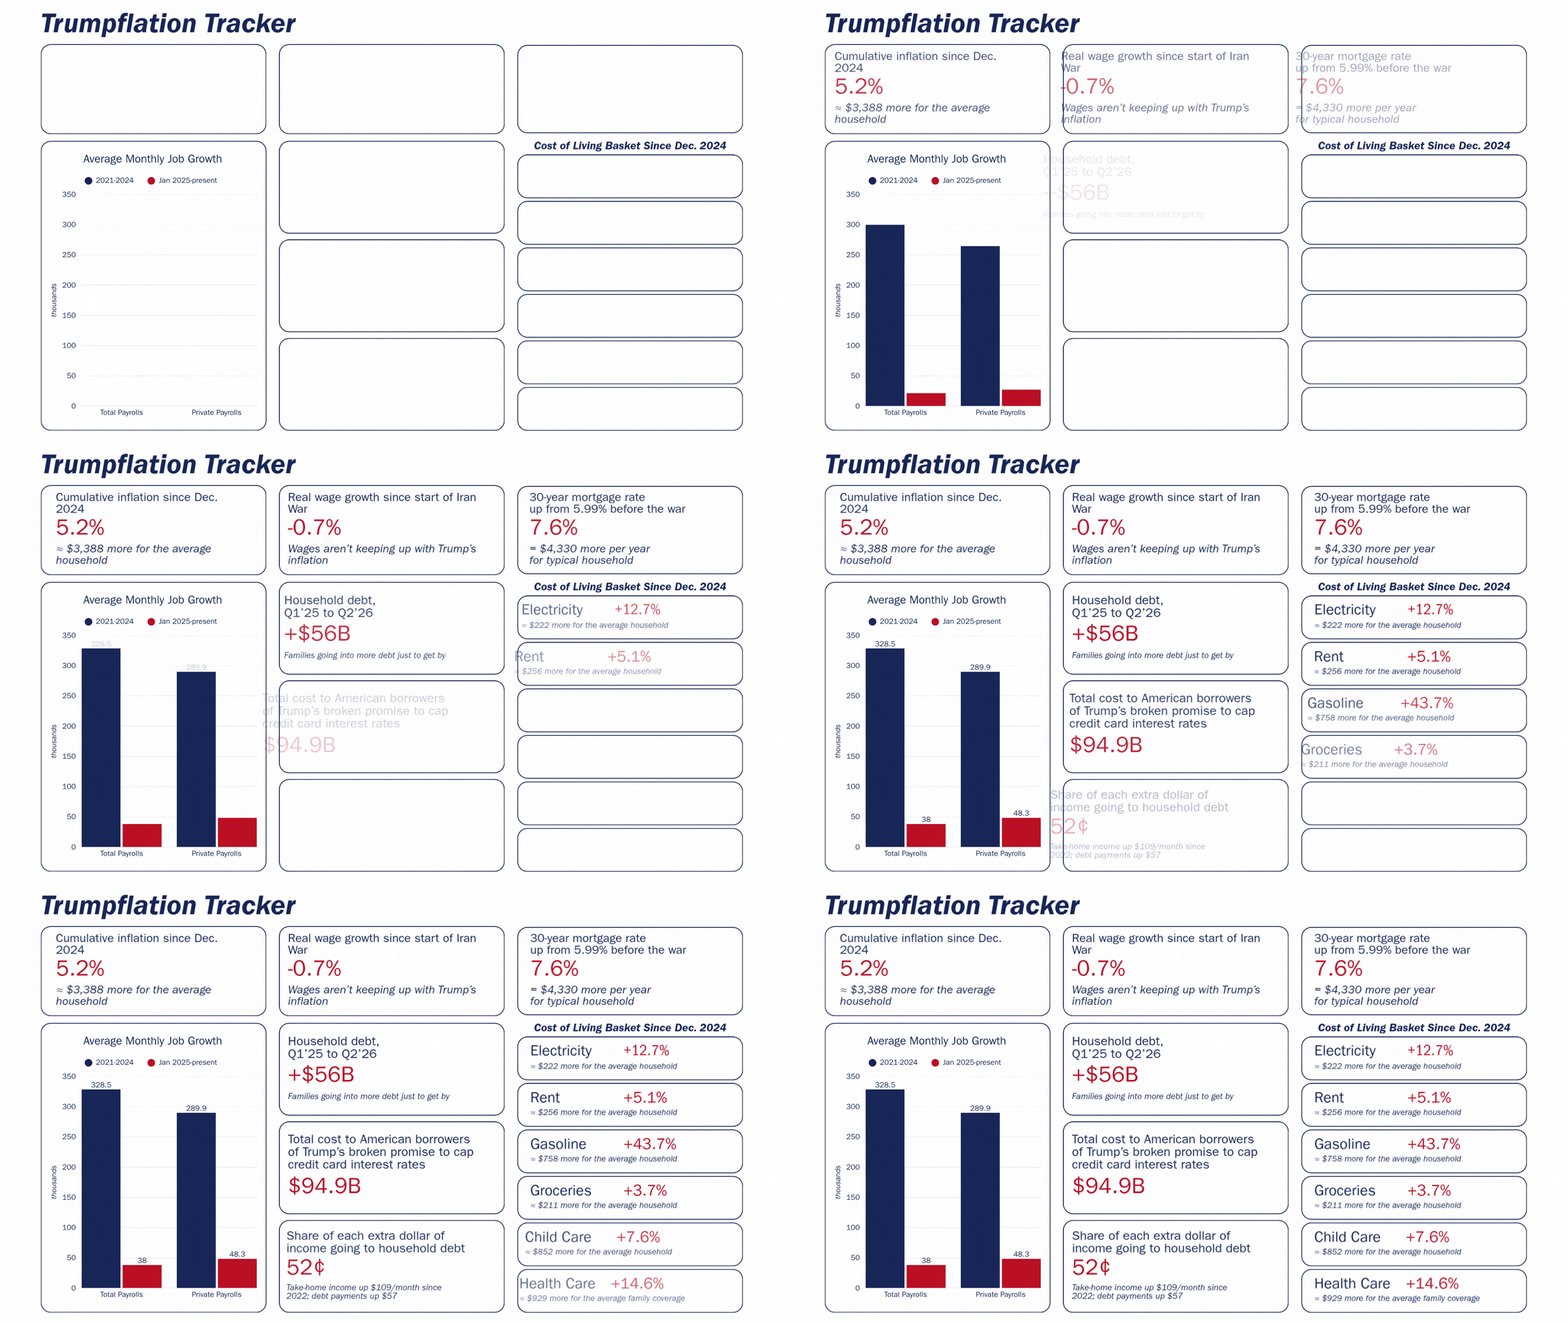
Now the exact same thing has happened to your food and other grocery prices. The prices went up and you were told its because of inflation/wars/pandemic/trade issues, etc and while all of those are true, its not the whole picture.

The food companies are increasingly spending more and more money on advertising (hence the insane growth in revenue for Google/Facebook/Netflix/ etc), and all of this comes from the consumer's pocket. Since the pandemic, the number of channels where a typical company has to spend ad money has gone up sharply. It's not enough to just run ads on radio, TV, newspaper and google. You also need pay the neighbourhood aislop influencer, you also need to buy space on 20 different ecommerce website. You have to buy space on the delivery apps, on streaming platforms, on reddit, on pinterest, on your BMW X5's dashboard, and so on and so forth.

There is always the option to cut spending here, and they don't. In fact, sometimes, they increase the spending here, despite all the inflation concerns.

Example - https://www.marketingweek.com/nestle-more-better-investment/

So yeah. they could make groceries cheaper, but they choose not to.

3


removepaywall.com

  • The yuan's share in payments for Russian exports has halved to 22% this year, and Russia now receives rubles for 69% of its exports in trade with Asia, highlighting the difficulties in finding an alternative global currency
  • The move away from the yuan has left Russian businesses facing problems with cross-border payments over secondary sanctions, with transactions becoming slower, more expensive, and less predictable due to the need to use intermediaries and more complex payment routes
  • Meanwhile, Russia's sales of gold to China have tripled year-on-year in the first nine months 2026, and jumped more than 55 times compared to the pre-war period, reaching 165 tons

...

Despite rising trade with China, the yuan’s share in payments for Russian exports has halved this year to 22% from its peak in mid-2024 when the US widened secondary sanctions, according to the latest Russian central bank data. In trade with Asia, Russia now receives rubles for 69% of its exports.

Russia’s experience represents an unprecedented experiment that ultimately showed the limitations of President Xi Jinping’s ambition to turn the yuan into a “powerful currency” for international trade, financial markets and central banks’ reserves. Chinese officials, however, have been equally clear they aren’t trying to turn the yuan into a replacement for the dollar, as Beijing keeps tight capital controls to guard currency flows.

Russia’s shift came after Chinese banks retreated in the face of threatened US secondary sanctions over the war in Ukraine. It demonstrates the US’ ability to enforce its political will, even with the world’s second-largest economy — and emphasizes the dollar’s global dominance.

...

Meanwhile, Russia continues to increase gold exports to China, which became the main export market for precious metals from Russia after the outbreak of war and the introduction of Western sanctions.

In January-September, Hong Kong received 165 tons of gold bars of Russian origin, according to customs statistics, the Center for Economic Forecasting of Russia's Gazprombank.

“Hong Kong is a free port without duties and VAT on gold and a direct access to the Chinese market, which did not impose sanctions against Russian gold,” analysts write. The path to the West for Russian precious metals was closed in 2022, when the London Association of Precious Metals Market Participants (LBMA) excluded Russian refineries from the list of suppliers, and the G7 countries banned imports. The first trading hub for the Russian metal was Dubai, but the UAE, under pressure from the United States and the United Kingdom, tightened control over the gold trade.

...

4
 
 
5


Peter Nowak of donotpassgo.ca podcast interviews Globe and Mail personal finance columnist Rob Carrick regarding new measures in the industry, Mark Carney’s approach to banking, and why Canadians’ reluctance to switch banks helps maintain the oligopoly.

also feel free to join our recently-launched discord: https://discord.gg/pFZWSdMxn

6


Archived (removepaywall.com)

[...]

In 2021, President Xi Jinping triumphantly declared that the rising tide had lifted all boats — the Communist Party had won “complete victory” over absolute poverty — and pledged to pursue “common prosperity”1 for all. China does deserve credit: Since 1978 it has lifted close to 800 million people out of extreme poverty, three-quarters of the global total, according to the World Bank. But to claim that victory, Beijing used a poverty line of about $2.30 a day, which critics contend is too low.

Against the World Bank’s $8.30-a-day poverty line for households in upper-middle-income countries — China’s current group — more than one-fifth of its population remained poor as of 2022. Against the $30 a day that marks poverty in the rich-country cohort China will be joining, the average citizen falls well short. China, in other words, is becoming a high-income country whose people, by any rich-world measure, remain exceedingly poor.

[...]

Both sets of facts flow from the same political economy, and the tension between them will define China’s next quarter-century — turning less on whether the country grows rich, which by conventional measures it largely has, than on what it does about the millions left behind and the middle class it never allowed to form.

[...]

[When China entered] the WTO, the bet was that prosperity would beget a middle class that would demand a say. But Beijing has spent two decades ensuring that constituency never takes shape, since time and time again history has shown that a secure, propertied population is where pressure for a political voice collects.

The evidence on social activism is instructive. In November 2022 a deadly apartment fire in remote Urumqi set off street protests against zero-Covid lockdowns that swelled into the “white paper revolution,” named after the blank sheets of paper demonstrators held up in wordless dissent. But these protests erupted not on China’s poor periphery but in its bourgeois core — along Urumqi Road in Shanghai, the country’s wealthiest city, and across elite campuses like Beijing’s Tsinghua University. The demonstrations confirmed the Party’s operating assumption: It is not hardship that is politically dangerous, but a comfortable middle class.

[...]

On the institutions that underpin a secure middle class — most importantly a social safety net — China diverges sharply from its peers. Social spending sits near 10% of gross domestic product, roughly half the average for countries in the Organization for Economic Cooperation and Development. Xi often warns that welfare programs breed idleness, a surprising stance for an avowed Marxist. The underlying motivation is more likely that households forced to self-insure stay precarious and pliable.

A grinding property crisis has only heightened the sense of vulnerability. Chinese households hold about 47% of their assets in real estate, and prices have fallen roughly a fifth from their 2021 peak, erasing trillions of yuan in wealth. Because a family’s home is often their only form of insurance, the loss of value has made people cling to cash all the more.

[...]

Beijing has promised for years to rebalance the economy toward household consumption, so as to reduce the country’s reliance on the twin growth engines of exports and investment. Yet after two decades of jawboning and half measures, consumption is stuck at about 40% of GDP, compared with 55% to 70% across the rich world. Households save at extraordinary rates — deposits have roughly doubled since 2019, to some 165 trillion yuan ($24.7 trillion) — not from thrift but because the Chinese state offers thin retirement pensions, patchy healthcare coverage and unemployment insurance that reaches barely a third of the workforce. Jobless benefits are pegged to the local minimum wage — not to what a worker earned — and is capped at 90% of that: roughly 2,000 yuan a month. This year the minimum rural pension has increased by just 20 yuan, to 163 yuan a month. A people who cannot count on the government to care for them when they are ill, jobless or old will not spend.

[...]

Youth unemployment tells the same story. The rate for 16- to 24-year-olds who are not in school now stands at 18% — an indicator so politically sensitive that Beijing suspended its publication in 2023, and then revised the methodology. A generation that coined the term neijuan, “involution,” shorthand for running ever faster to stay in place, is not the confident spending cohort a middle class is built on.

[...]

The artificial intelligence boom deepens the divide between the government’s industrial ambitions and household welfare. Beijing is pouring trillions of yuan into the development of more advanced chips and data centers to support AI, and that spending is, for now, what is powering growth. But it funds those technology investments by** starving the basics: hospitals, schools and other elements of the already meager safety net in rural areas**, while the rewards accrue to the coastal, educated sliver.

The resulting inequality would look familiar to any American. With the poor and middle held down, one group has been allowed to grow: the rich. China’s richest 10% of the population hold about 68% of its national wealth, close to the US figure of 70%. In 2025 the 1,434 individuals worth at least 5 billion yuan saw their combined wealth soar 42% thanks to a powerful stock market rally, according to an annual list compiled by the Hurun Research Institute, a Shanghai-based firm that has tracked China’s rich since 1999.

[...]

Common prosperity, Xi’s supposed sequel to Deng’s “let some get rich first,” is turning out to mean shared restraint, not shared wealth: billionaires disciplined when convenient, the middle class asset-trapped, the poor pacified in 20-yuan increments. Everyone, in the end, is held equally in check.

[...]

During 14 years in power, [Xi Jinping] has chosen control over household welfare at every turn, and for the fourth presidential term he’s expected to claim in 2027, there’s no reason to expect a change of course. So the likeliest path is welfare that grows but stays minimal and conditional: enough to keep the peace, and calibrated to sustain dependence rather than end it.

The West wagered in 2001 [when China entered the WTO] that trade would make China rich and wealth would make it liberal. It got the first half. Whether a great power can hold the rest together while keeping most of its citizens poor is, at best, a formula for grinding stagnation — at worst, a slow-burning fuse.

[...]

7
 
 
8
9
10
11


Does anyone know or better yet have resources on how the real wages (wages adjusted for inflation and buying power) have evolved for different percentiles of the national income share of Germany or the USA? As I understand it real wages are calculated from the income of an average citizien. This ignores outliers like people who's total incomes increased a lot and thus can average out many people who's total income decreased only a little.

12
 
 
13
14


Archived

Indonesia is the world’s largest nickel producer, accounting for a dominant share of global output and making the country increasingly central to the global critical-minerals supply chain.

[...]

Indonesia's rise as a nickel power is inseparable from its resource nationalist downstreaming strategy. Jakarta restricted exports of unprocessed nickel ore and pushed companies to process the mineral domestically. The policy transformed Indonesia from a major raw-material supplier into a global processing hub.

But Indonesia did not build this transformation alone. Chinese capital, technology, and industrial expertise became deeply embedded in the country's smelting and refining ecosystem. Today, Chinese firms control about 75% of Indonesia's nickel-refining capacity, illustrating the depth of this dependence.

This creates Indonesia's central paradox: Jakarta has greater control over the resource, but much of the capacity required to convert that resource into higher-value products remains connected to Chinese investment and technology. Resource nationalism therefore has not eliminated dependence; in some respects, it has created a more sophisticated form of it.

[...]

Indonesia is now trying to change that equation. President Prabowo Subianto's government has tightened oversight of strategic commodities and is seeking greater control over how resources are priced and traded.

In August 2026, Prabowo announced plans to launch the Strategic Minerals and Commodities Exchange that would establish domestic reference prices for strategic resources including nickel, with operations expected to begin in January 2027.

[...]

He argued that Indonesia should move beyond being merely a resource exporter and become a price-setter. These policies have created friction with Chinese investors. In May 2026, Chinese companies operating in Indonesia warned that reduced nickel quotas, higher taxes and revised pricing arrangements were making operations more expensive. The China Chamber of Commerce in Indonesia raised concerns directly with the Indonesian government, with several major Chinese-linked companies also facing the impact of these policy changes. But this is where the story moves beyond Indonesia and China.

[...]

The United States increasingly sees Indonesia as important to its effort to build more diversified critical-mineral supply chains. In February 2026, Washington and Jakarta signed an Agreement on Reciprocal Trade containing a section 5 intended to align Indonesia with the U.S. on sanctions, export controls, investment security, and measures targeting third-country economic practices, strengthening bilateral economic-security cooperation on critical minerals.

[...]

This does not, however, mean that Indonesia has chosen America over China. Calling the relationship a US–Indonesia “alliance against China” would oversimplify Jakarta's strategy. The agreement is fundamentally an economic and strategic partnership, while Indonesia continues to maintain substantial economic relations with Beijing. The distinction is crucial. Indonesia does not necessarily need to replace China; it needs alternatives to China.

If China remains Indonesia's dominant source of investment, processing technology and industrial partnerships, Jakarta's ability to impose tougher terms has limits. But if American, Japanese, Korean, European and other investors can provide additional capital, technology and markets, Indonesia acquires greater room to negotiate. This is the essence of Jakarta's strategy: diversification as leverage.

[...]

Indonesia's nickel policy is therefore not simply about who mines nickel or who owns a smelter. It is about who gets to set the terms of participation in the value chain. Indonesia may not be choosing between Beijing and Washington. It is attempting something more ambitious: making both compete for access while Indonesia strengthens its own position. The success of that strategy will ultimately depend on whether Jakarta can convert its geological advantage into industrial and technological capability. The real prize is not simply higher revenues from nickel but the ability to decide who participates, under what conditions, and how much value remains within Indonesia.

[...]

15


Census of every prose-only duty line in the US Harmonized Tariff Schedule: 550 of 23,193 HTS lines carry no numeric rate, only sentences like "the rate applicable to products provided for in preceding subdivisions". The article sorts them into six resolution patterns and shows how to compute each effective rate from primary sources. Maintained as part of a free tariff-data project; the full table with source timestamps is here: https://exportsonar.com/guides/nonstandard-duty-rate-text-guide.html?src=lemmy-dbzer0

16


Every one of the 7,045 eight-digit US lines covered by the Section 301 China actions carries the same incremental rate - 25 percent - but the map underneath is anything but uniform. We rebuilt the full map from our structured extract of the Chapter 99 trade-action schedule, cross-checked against the USITC REST API on October 13, 2026:

  • Organic chemicals lead with 692 taxed lines, followed by machinery (chapter 84) at 671, electrical machinery (chapter 85) at 448 and fish (chapter 03) at 269.
  • The three legal anchors split unevenly: U.S. note 20(e)+20(f) holds 5,906 lines (83.8 pct), note 20(b) 856 (12.2 pct), 20(c)+20(d) 283 (4.0 pct).
  • Fifteen chapters carry zero lines under the three 25 pct actions - including the entire apparel-and-footwear complex.
  • Since the action rate stacks on the base rate, the page also publishes the base-rate census under the 25 pct layer.

Chapter-by-chapter map, free, no signup: https://exportsonar.com/guides/section-301-line-exposure-map.html?src=lemmy-dbzer0-g23

Happy to share details about the data pipeline; corrections welcome.

17


For nearly a decade, any shipment worth $800 or less entering the United States cleared duty-free under the Section 321 de minimis exemption (19 U.S.C. §1321(a)(2)(C)). That carve-out quietly carried cross-border e-commerce logistics through three administrations — and it is now suspended for shipments from every country, in every quantity, by every transport mode.

I maintain a free tariff-data project and we rebuilt the full 2016–2026 timeline from 21 dated legal instruments (Federal Register notices, executive orders, Public Laws), each linked to its primary source and cross-checked against the live CFR — including the August/September 2025 executive orders and the October 2026 final rule that made the suspension permanent-looking in the regulations:

https://exportsonar.com/guides/us-de-minimis-section-321-timeline.html?src=lemmy-dbzer0

Happy to answer questions on how the data pipeline sources and timestamps each instrument.

18
Labour’s share (thenextrecession.wordpress.com)
submitted 1 month ago by to c/economy@lemmy.world
19


20
21


The Bloomberg Billionaires Index reveals how much money is at stake as the ultra-wealthy leave.

https://archive.is/20261006130711/https://www.bloomberg.com/news/features/2026-10-04/billionaire-exodus-from-uk-leaves-160-billion-hole

22
 
 
23
24
 
 
25


cross-posted from: https://piefed.world/c/economy/p/1439158/economy-adds-just-29000-jobs-in-september-wage-growth-slows-to-3

  • Job growth slowed sharply, with just 29,000 jobs added in September and the three-month average falling to 51,000.
  • Wage growth weakened further, reaching 3.0 percent year-over-year and 2.6 percent annualized over the latest three months.
  • Health care and social assistance drove job growth, accounting for 23,000 of September’s 29,000 new jobs.
  • Evidence of AI-driven job losses remains limited, with declines concentrated in sectors such as insurance, publishing, and motion pictures.
  • The labor market is weakening beneath the headline unemployment rate, with fewer workers quitting voluntarily and several disadvantaged groups seeing higher unemployment.
  • There is little evidence of an AI-driven productivity boom so far, with estimated productivity growth only slightly above recent trends.
view more: next ›