all 8 comments

sorted by: hot top controversial new old
[–] 14 points 1 year ago (2 children)

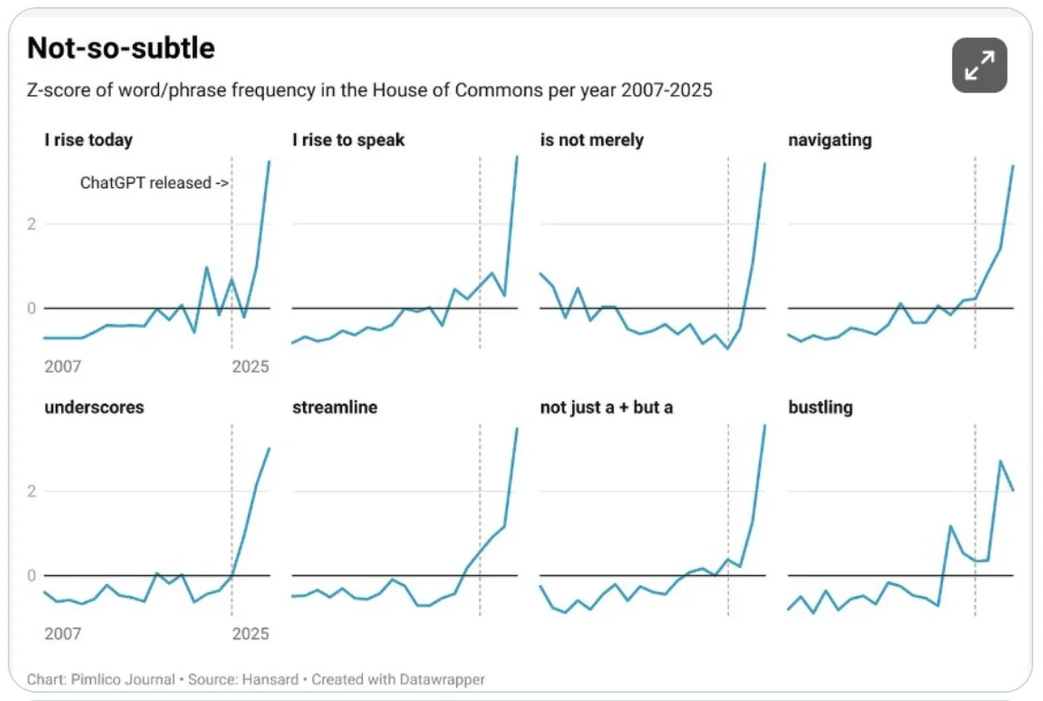
I can accept the premise that LLMs are being used to write Commons speeches -- MPs are also people, I'm told -- but these graphs suggest that LLMs are overusing certain stock phrases which have existed in the business world and apparently in Commons speeches since at least 2007.

What puzzles me is why LLMs are more prone to using these particular phrases. Does this happen for all users of LLMs, or only when British MPs in particular are requesting a speech?

I'd be interested to know if the same trend for the same phrases can be found in the Canadian House of Commons, since although they also follow much of the same procedures, North American English should skew the frequencies of certain words. So if the same trend can be found, then that suggests that the common LLMs do lean towards certain phrases. But if the trend is not statistically significant in Canada, then perhaps British MPs issue different prompts than their Canadian counterparts.

What I'm saying is that I rise today to highlight additional avenues of intrigue, as MPs and citizens alike are navigating a world where AI supposedly streamlines daily activities. That certain trends may or may not exist underscores the gravity of this seemingly bustling industry that we call AI.

[just to be clear, that last paragraph is entirely in jest]

  • source
  • hideshow 2 child comments
  • [–] 7 points 1 year ago* (last edited 1 year ago)

    I think it's a feedback loop. AI is trained off publicly available datasets like House of Commons records so popular words only get more popular the more AI slop is in there, since LLMs fundamentally just predict the next word given the context without much "logic" behind it.

    Given enough time this will make LLMs basically unusable as public data gets contaminated with AI slop. But unfortunately that will also mean the public data itself is basically unusable.

  • source
  • parent
  • [–] 4 points 1 year ago

    My guess would be that they were manually written by individuals then certain words did overlap and become more common. Which would be normal for the language of a system.

    However now the speeches are being written by the essentially the same author. Which works by looking for patterns and repeating them. So those common words become even more common. Which the model then picks up and makes sure to include more. Repeat until no diversity exists.

    That's the actual future of AI.....

  • source
  • parent
  • [–] 4 points 1 year ago (1 child)

    Here's a thought: instead of fighting this, make it a requirement to publish the prompts before making a speech. Speeches by politicians being low in information density is nothing new, and the usage of LLMs will undoubtedly make that worse, but it also means that they had to have written a terse description of the information they want to convey. If that were public, people could just read that and not waste time listening to speeches.

    It would be ironic if the first use-case for LLMs that creates positive value for society involves ignoring its output, though.

  • source
  • hideshow 1 child comment
  • [–] -2 points 1 year ago (2 children)

    Given enough data, you can prove anything. Correlation doesn't imply causation folks!

  • source
  • hideshow 2 child comments
  • 12 comments in c/dataisbeautiful@mander.xyz view that post
    [–] 17 points 1 year ago*
    [–] 11 points 1 year ago (5 children)

    Nice. Though a bit of context would be helpful. What is a z-score? Where is this from, and where can I read more?

  • source
  • hideshow 5 child comments
  • [–] 20 points 1 year ago (4 children)

    A z score is a statistical concept that measures the rate above or below the mean something is

  • source
  • parent
  • hideshow 4 child comments
  • [–] 6 points 1 year ago (3 children)

    In many cases, a z-score between -2 and +2 is common. Anything outside that range is rare. Further away from zero you go, the rarer it gets.

    In real life though, not all things follow the normal distribution, so z-scores aren’t always so easy to interpret. If the distribution is far from normal, z-scores are only marginally useful.

  • source
  • parent
  • hideshow 3 child comments
  • [–] 2 points 1 year ago (2 children)

    To add, about 2.5% of cases are below -2 and another 2.5% above +2 (specifically 1.96), so long as the original metric is normally distributed (bell shaped). About 68% of cases actually fall between -1 and 1, as most things tend to be close to average. That's true of pretty much any true normal distribution, btw.

    It's a neat way to basically say, this isn't a normal amount of phrase usage. It's not a statistical test, though those concepts use a similar approach to probabilities.

  • source
  • parent
  • hideshow 2 child comments
  • [–] 3 points 1 year ago (1 child)

    When dealing with real world data, it’s always a good idea to check how normal it is. If that assumption is grossly violated, you have to work a bit harder and use more robust methods.

    When it’s reasonably close to normal, you can take all sorts of nice shortcuts like z-scores and t-tests. I haven’t looked into this case yet, but I assume they knew what they were doing.

  • source
  • parent
  • hideshow 1 child comment
  • [–] 3 points 1 year ago

    Yup, although technically you can still run z-tests and t-tests for statistical validity because samples are always normally distributed around a population mean (as long as it's a large enough sample), even for skewed or uniform distributions. Some tests work better than others, though. The graphs z might be a sample, which might make sense is population data is available for these phrases, but otherwise I'm a little confused why that'd use it, lol.

    To clarify for the commenter, though, Z-scores themselves can be applied to individuals; it's just a simple conversation setting mean to 0 and standard deviation to 1. In that case, it's strictly a relative case, that 2.5% isn't a probability so much as the percentile -- % cases that fall below that score. It's a nifty metric to compare things that aren't on the same scale, for instance.

  • source
  • parent
  • [–] 3 points 1 year ago* (last edited 1 year ago) (1 child)

    A totalitarian regime using Ai to push their agenda. Big surprise. How about y’all get out and vote better before you can’t even access websites anymore. Oh wait…

  • source
  • hideshow 1 child comment
  • [+] -7 points 1 year ago (2 children)
  • [–] 8 points 1 year ago (1 child)

    If my representative was using a robot to decide how to promote their ideas, I’d be pissed.

    These people were elected to represent the people based (presumably) on their own words and opinions. If they can’t muster the energy to support their constituents themselves, without relying on a robot to spew up generic bile, then they should step down and let someone who cares do it.

  • source
  • parent
  • hideshow 1 child comment