Welcome to the discussion of US Politics!
Rules:
- Post only links to articles. Title must fairly describe link contents. If your title differs from the site’s, it should only be to add context or be more descriptive. Do not post entire articles in the body or in the comments.
Links must be to the original source, not an aggregator like Google Amp, MSN, or Yahoo.
Example:
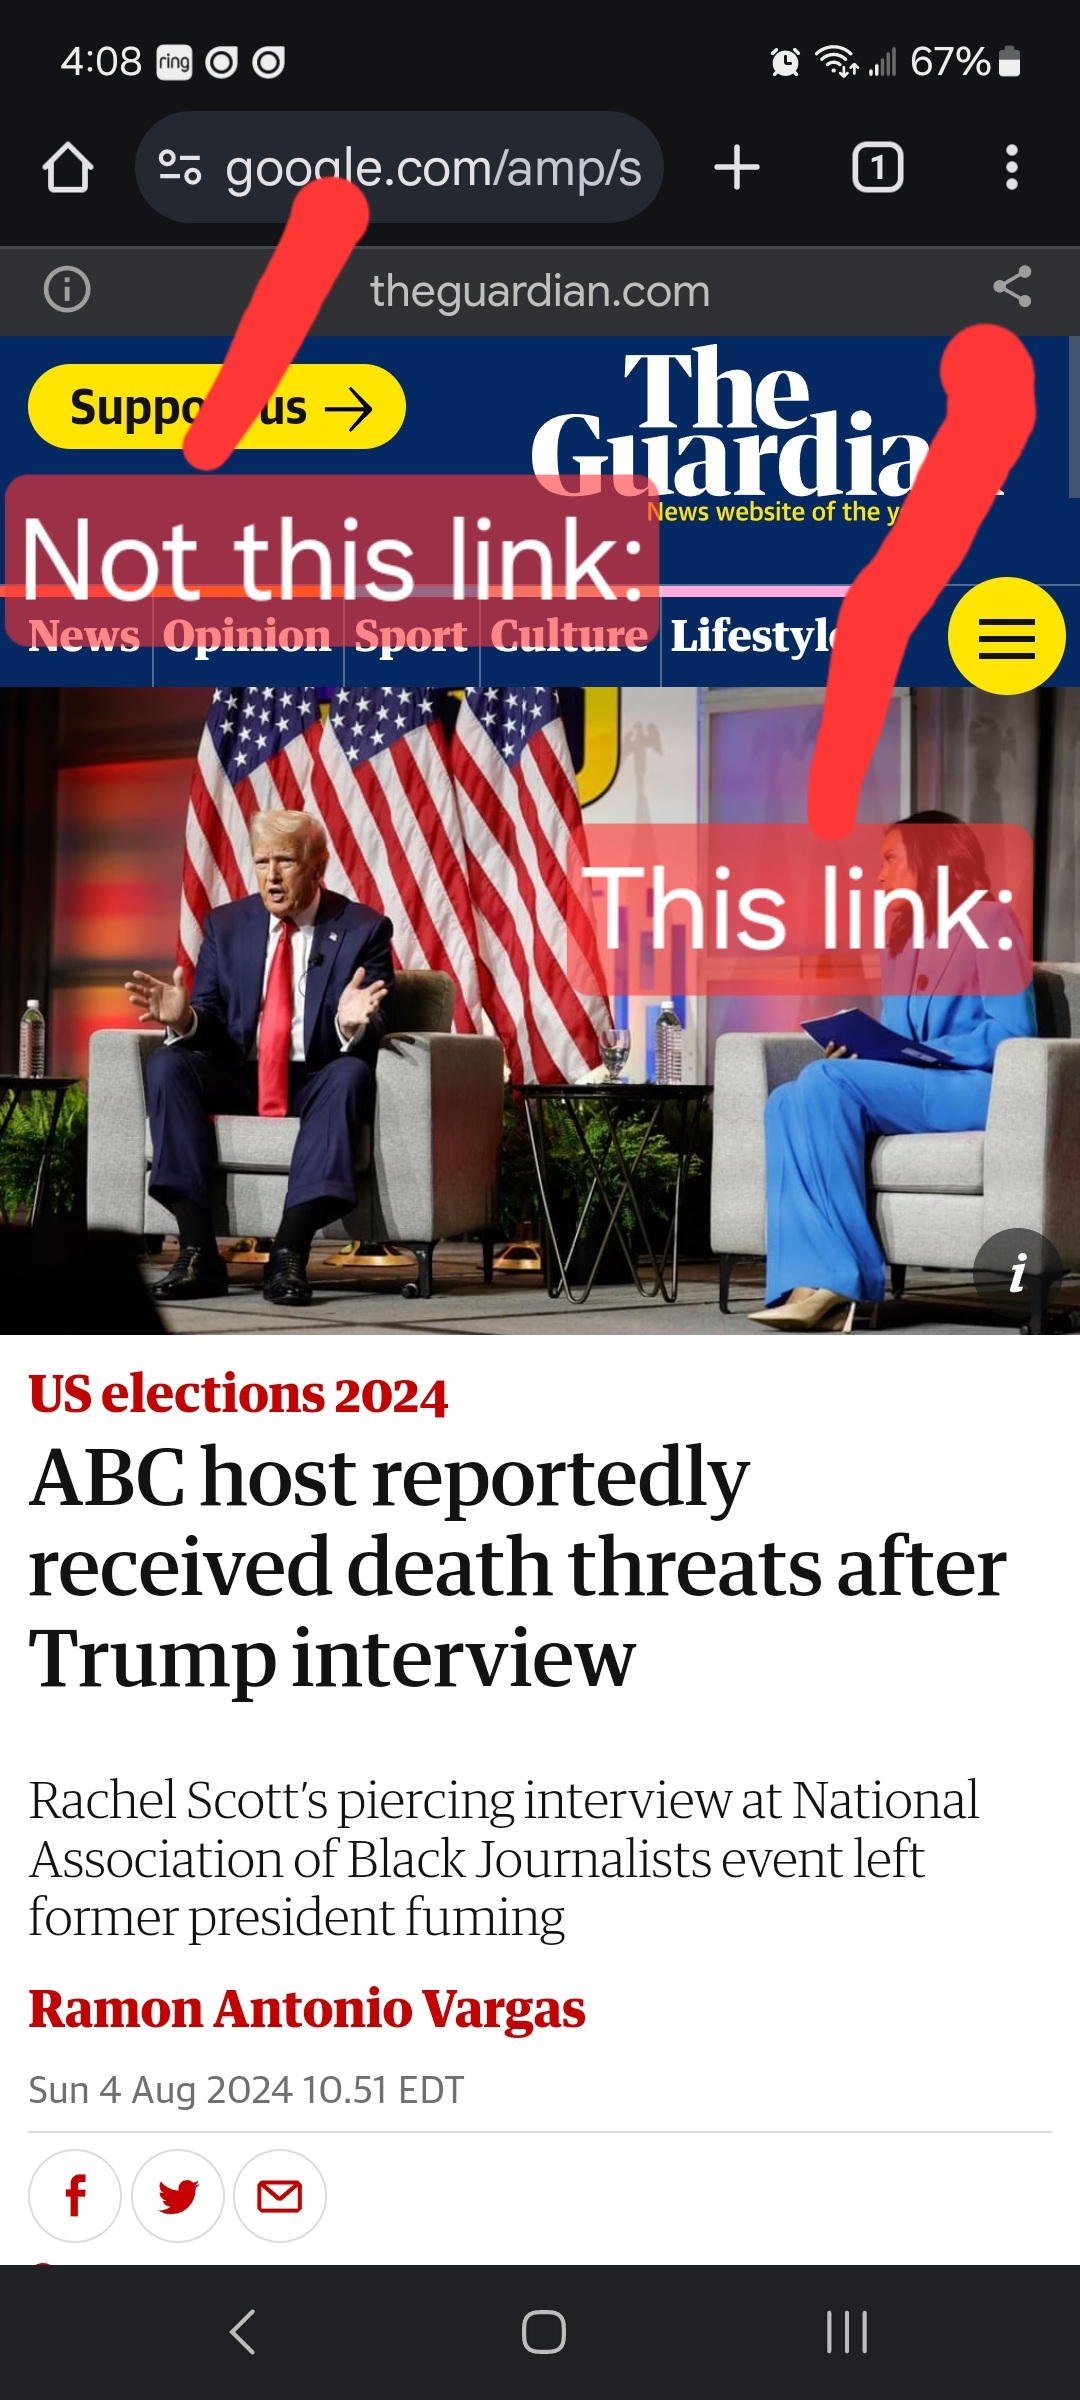
- Articles must be relevant to US politics and contain quality and original content. Social Media adjacent hosts like Substack are allowed, but ONLY if they tie back to a company/subsidiary. No personal or friend group blogs and no self-promotion. Articles should be worth reading. Clickbait, stub articles, and re-hosted or stolen content are not allowed. Check your source for Reliability and Bias here.
- Be civil, No violations of TOS.
It’s OK to say the subject of an article is behaving like a (pejorative, pejorative). It’s NOT OK to say another USER is (pejorative). Strong language is fine, just not directed at other members. Engage in good-faith and with respect! This includes accusing other users of being bots or paid actors.
- No memes, trolling, misinformation, or low-effort posts/comments (including reposts). If you see posts like this that anger you, do not engage. Report, block, and live a happier life than they do. Any slap-fight is subject to comment removals. Fights full of rule violations will result in temporary bans to cool off.
- No manipulating votes via bots or alt accounts; this will result in permanent bans. Vote based on comment quality, not agreement. This community aims to foster discussion; please reward people for putting effort into articulating their viewpoint, even if you disagree with it.
- No hate speech, slurs, celebrating death, advocating violence, or abusive language. This will result in an account ban. Usernames containing racist, or inappropriate slurs will be permanently banned.
We ask that the users report any comment or post that violate the rules and use critical thinking when reading, posting, and commenting. Users that repeatedly have comments or posts removed, weaponize reports, or violate the code of conduct, will be banned.
All posts and comments will be reviewed on a case-by-case basis. This means that some content that violates the rules may be allowed, while other content that does not violate the rules may be removed. The moderators retain the right to remove any content and ban users. The reason(s) behind moderator action(s) are publicly available through the Modlog.
That's all the rules!
Civic Links
• Register To Vote
• Citizenship Resource Center
• Congressional Awards Program
• Federal Government Agencies
• Library of Congress Legislative Resources
• The White House
• U.S. House of Representatives
• U.S. Senate
Partnered Communities:
• News
• World News
• Business News
• Political Discussion
• Ask Politics
• Military News
• Global Politics
• Moderate Politics
• Progressive Politics
• UK Politics
• Canadian Politics
• Australian Politics
• New Zealand Politics