This seems like a problem
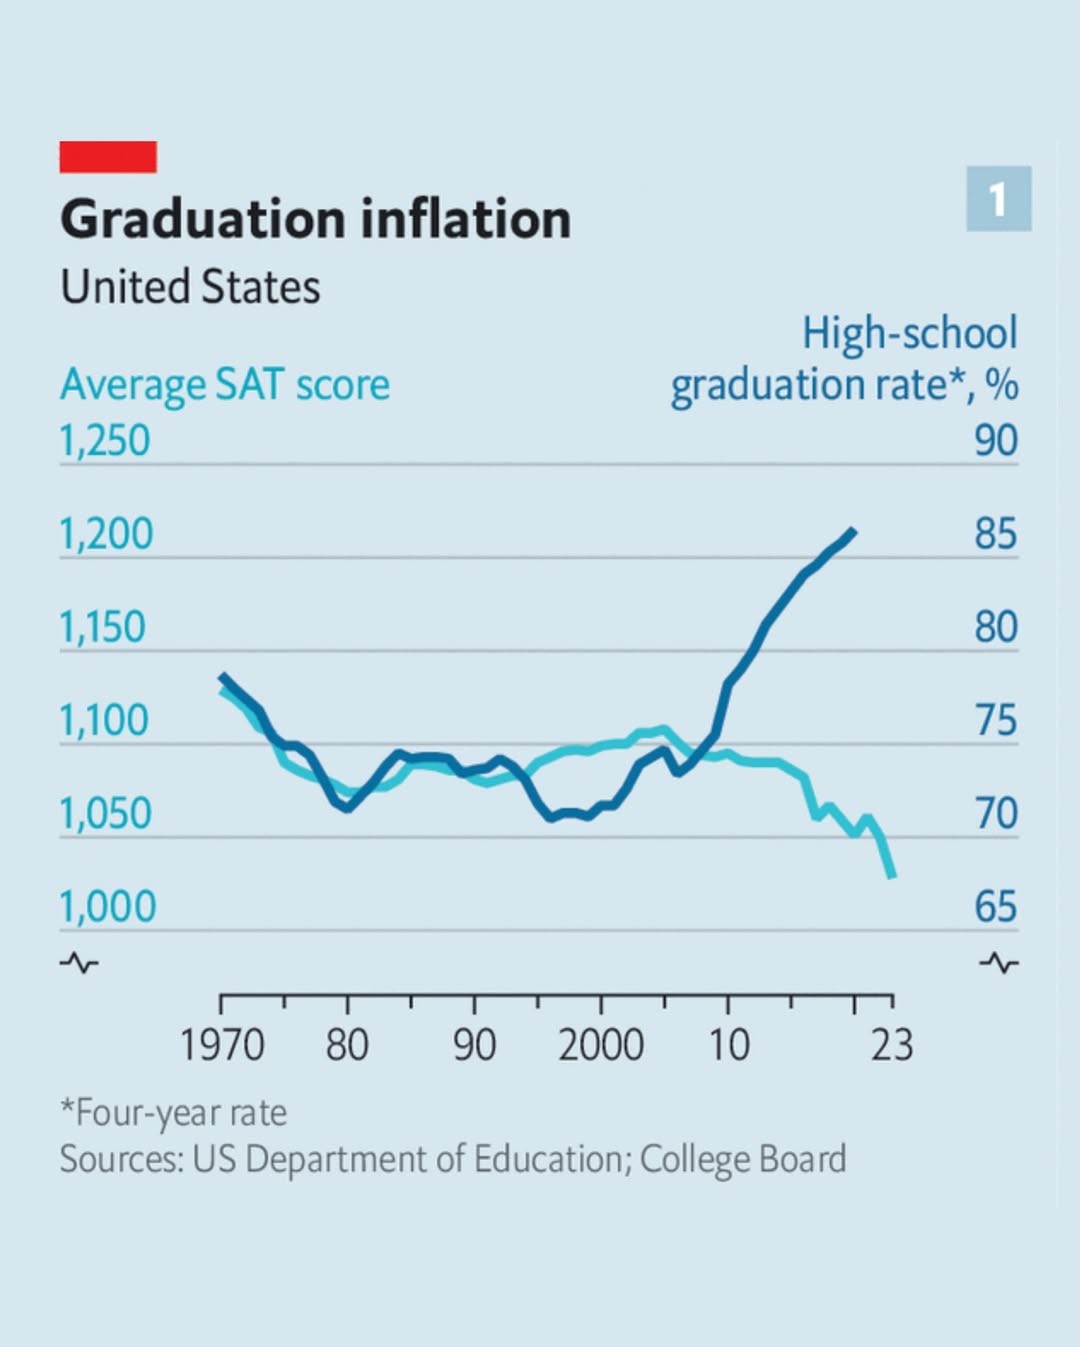
This seems like a problem
I generally agree that the graph doesn't imply anything bad, but without knowing the distribution of test scores, we can't conclude that average sat performance actually improved. With a general sat score statistic we could attempt to predict how an X% increase in presumed low performers looks like, and then compare that to reality.