This seems like a problem
you are viewing a single comment's thread
view the rest of the comments
[โ€“] 4 points 10 months ago (2 children)

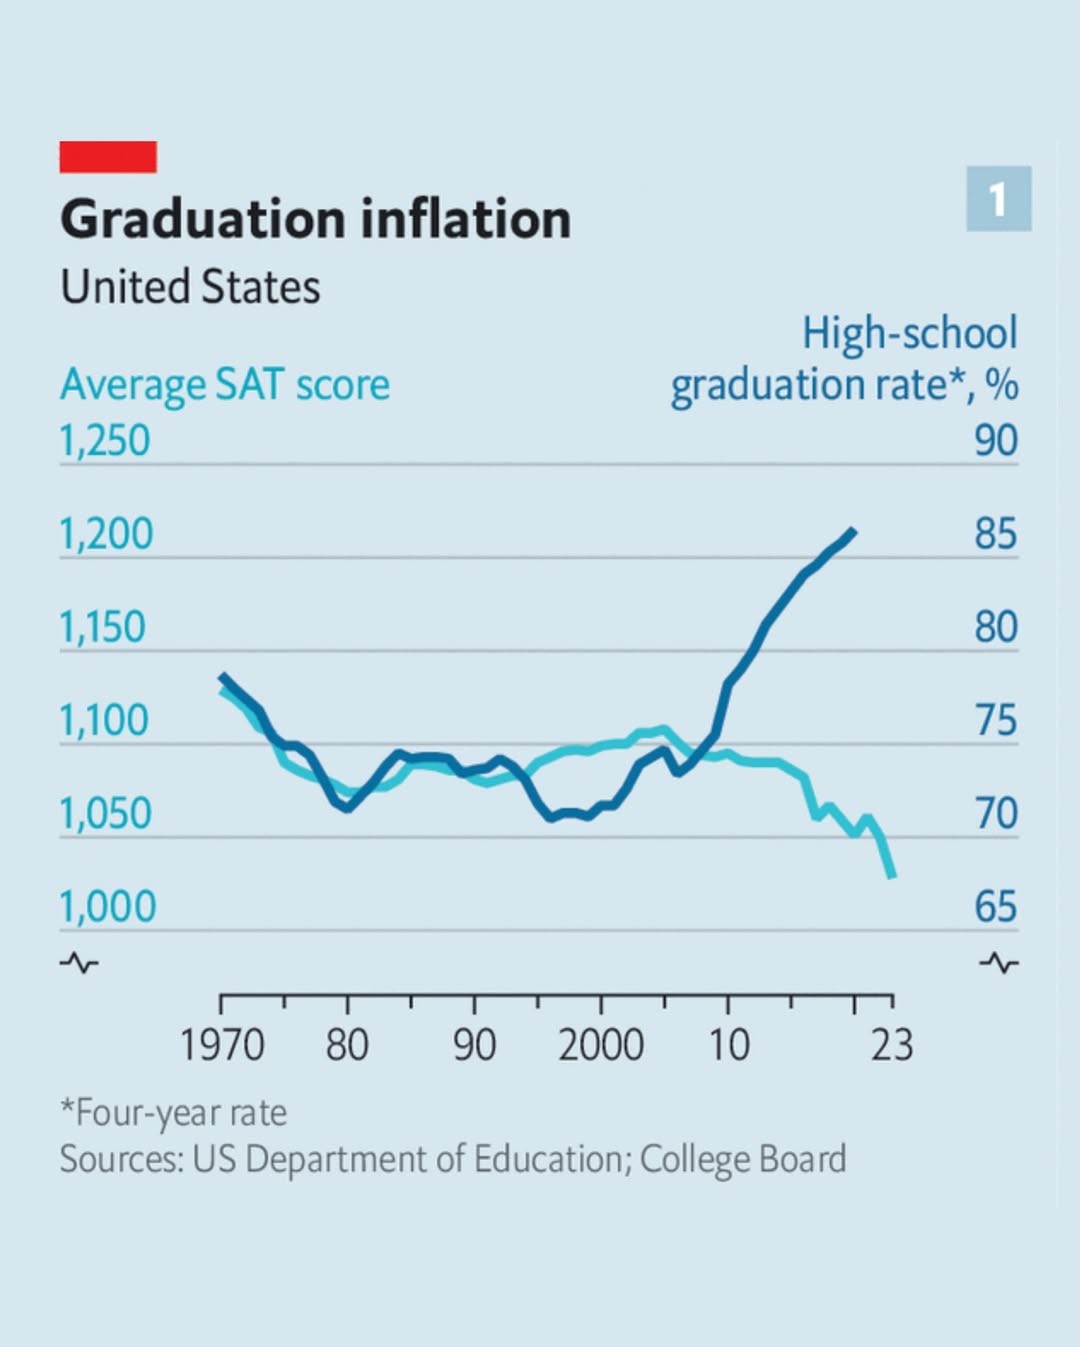
This graph is actually encouraging and I suspect anyone who cannot process why doesn't have high sat scores.

More people are graduating. People who drop out don't take the sat. Since the sat drops at a slower rate then the graduation rate increases, those previous drop outs are on average better at the sat.

Analysis of this graph could be an sat question.

  • source
  • parent
  • hideshow 2 child comments
  • [โ€“] 2 points 10 months ago (1 child)

    I generally agree that the graph doesn't imply anything bad, but without knowing the distribution of test scores, we can't conclude that average sat performance actually improved. With a general sat score statistic we could attempt to predict how an X% increase in presumed low performers looks like, and then compare that to reality.

  • source
  • parent
  • hideshow 1 child comment
  • [โ€“] 1 point 10 months ago

    The graph indicates the average test score dropped. I'm looking at what can be inferred from this limited data and how it could be structured to reveal a person's ability to apply critical thinking.

    The graph alone isn't enough, it would need some blurb with the details you're mentioning and more to make the choices unambiguous.

  • source
  • parent