We’re announcing the 2.12.1 minor patch release of #LabPlot with small improvements and bug fixes. :boost_love: 🚀 labplot.org/2025/08/18/labplotWe recommend everybody update to this patch release which is available from our download page:labplot.org/download/New features and enhancements are coming in the next major release. Stay tuned!#FLOSS #FOSS #OpenSource #DataAnalysis #DataViz #Science #Statistics #Research #NLNet @labplot@lemmy.kde.social @opensource @alternativeto @omgubuntu @9to5linux @NGIZero
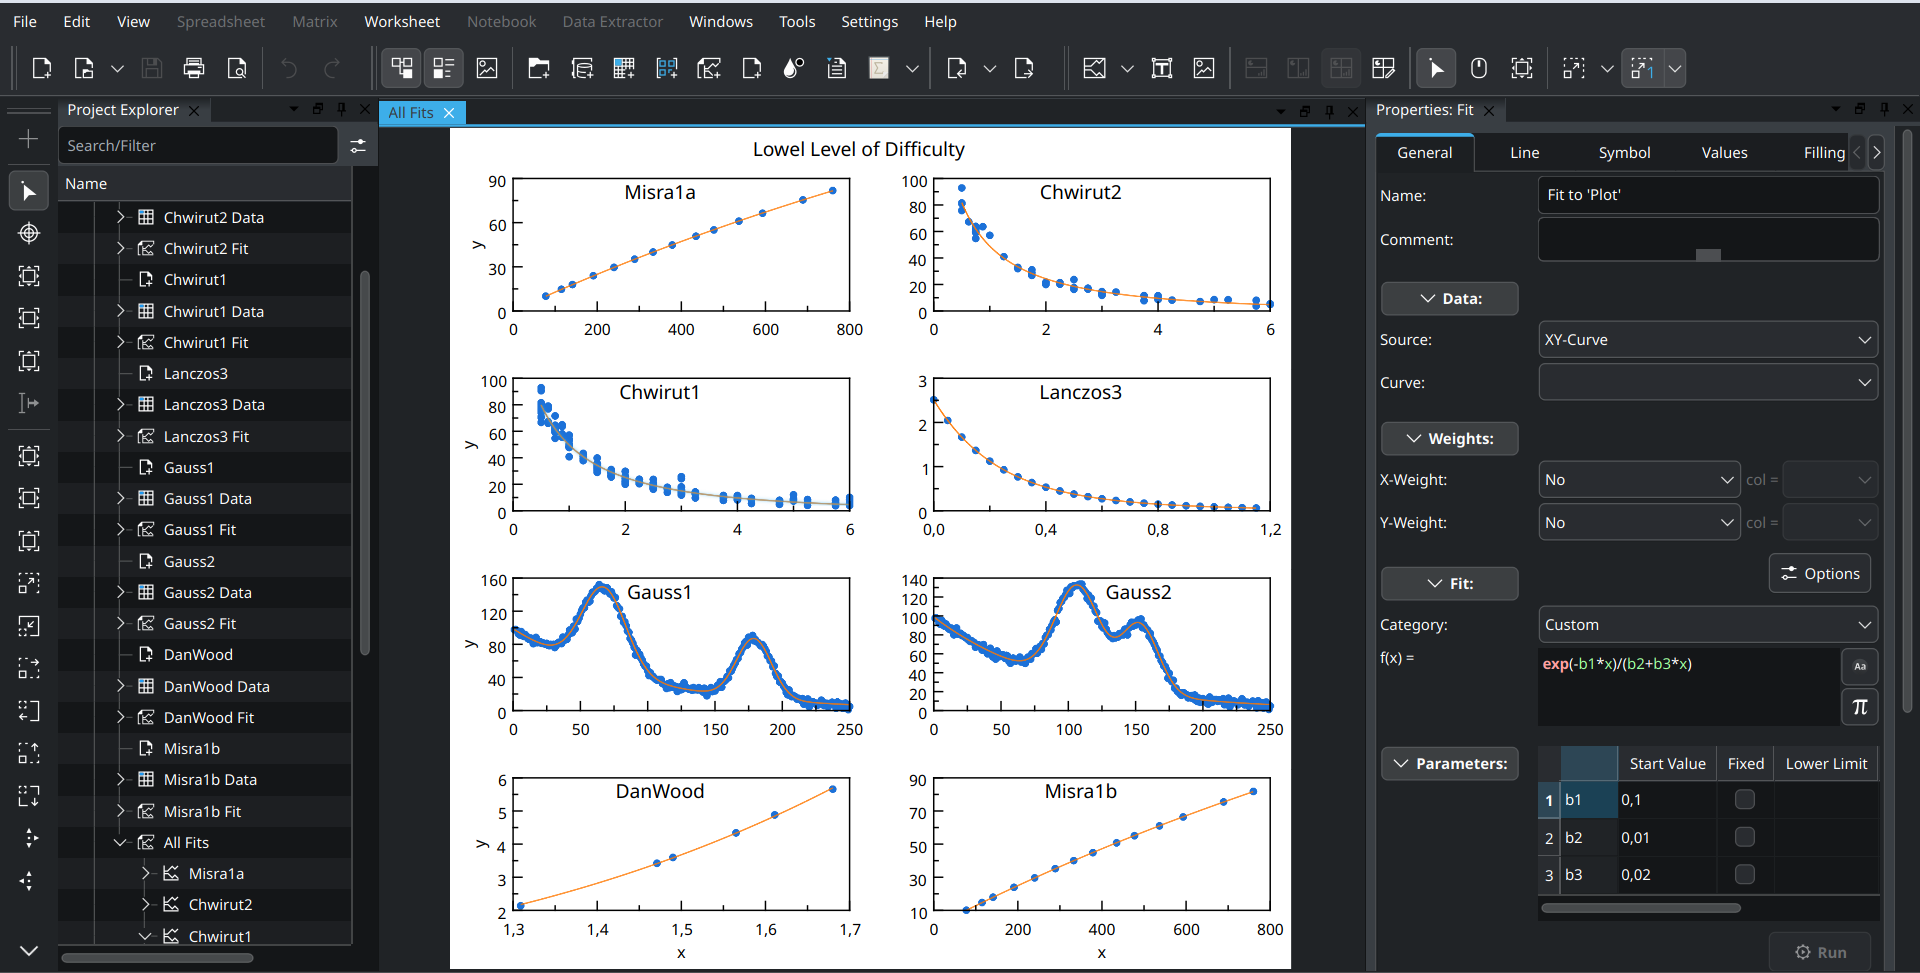
A screenshot showing 8 interesting-looking graphs in LabPlot's interface.
you are viewing a single comment's thread
view the rest of the comments
[–] 2 points 1 year ago*

My work revolves around taking tons of data with a python script, then processing it and generating graphs in another script. E.g. I measure y as I modify v, p, s, and f. And then at each v, p, and s, I look at y vs. f and extract some value k, then look at k vs s at each v, p and extract a j, then plot j vs v and p.

How would labplot fit into this? I've been thinking about what the next change in my plotting would be, and I've considered either adding on-click functionality to my existing script so I can click a v, p, j point to see the k vs s graph that gave that j; or possibly using some library that gives some web-browser based control of graphing. But if labplot seems well suited to this I can also add it into the contenders

  • source
  • parent