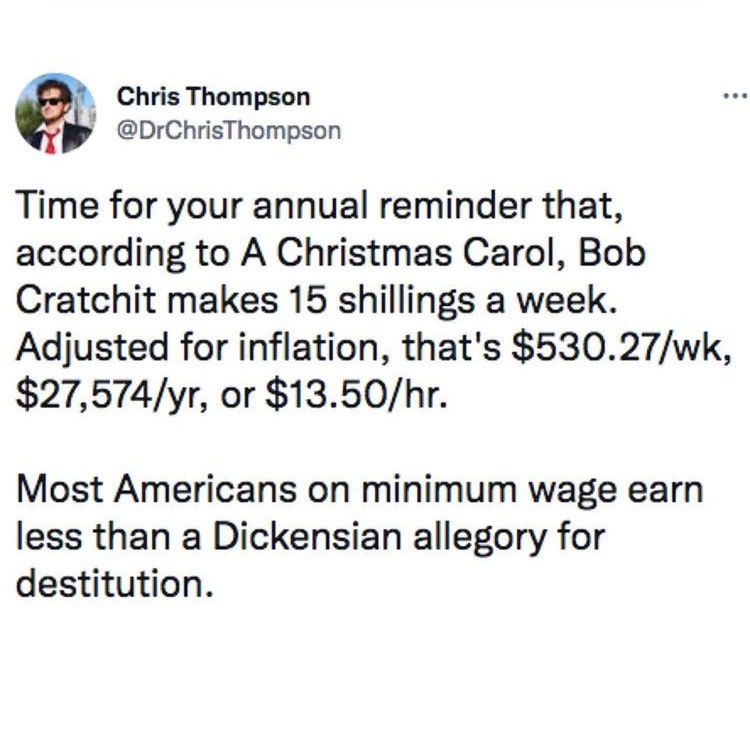
Dickensian (quokk.au)
submitted 1 month ago by [A] to c/mop
 
Dickensian

all 14 comments

sorted by: hot top controversial new old
[–] 27 points 1 month ago (1 child)

I suspect Scrooge kept Bob Cratchit working for more hours than what's in the modern workweek, skewing the per hour.

Not that that's an argument against raising the minimum wage today.

  • source
  • hideshow 1 child comment
  • [–] 9 points 1 month ago

    Taking minimum federal wage of $7.25 Bob Cratchit would have around 73 hour work weeks. That makes around 10-11 hours a day every day or around 12 hours Monday to Saturday. It skews numbers, but still the destitution allegory works.

    I'm not an USA-ian.

  • source
  • parent
  • [–] 17 points 1 month ago (6 children)

    Um actually, that's actually $13.26/hr 🤓

    But fun fact: That only makes a difference for one state. Nebraska has $13.50/hr as their minimum. In total there are 22 states which are higher.

    Less fun fact: 20 of the states use the federal minimum wage, which is $7.25/hr.

  • source
  • hideshow 6 child comments
  • [–] 4 points 1 month ago (5 children)

    Just out of curiosity, what colour are those states on political maps?

  • source
  • parent
  • hideshow 5 child comments
  • [–] 9 points 1 month ago* (4 children)

    I used this as my source.

    It seems like out of the 20 states using the federal minimum wage, only New Hampshire is blue.

    Average minimum wage:
    Red: ~$9.04/hr
    Blue: ~$14.86/hr

    Median minimum wage:
    Red: $7.25/hr
    Blue: ~$15.13/hr

    Edit: This, of course, doesn't take buying power into account. So take it with a grain of salt I guess. Or feel free to work it out yourself and post it for the rest of us... 😄

  • source
  • parent
  • hideshow 4 child comments
  • [–] 2 points 1 month ago (3 children)

    Which states did you use for red/blue? Is it based on the last election results?

  • source
  • parent
  • hideshow 3 child comments
  • [–] 2 points 1 month ago (2 children)

    Yep. I'm not American though, so I could certainly have made a mistake somewhere.

  • source
  • parent
  • hideshow 2 child comments
  • [–] 2 points 1 month ago* (last edited 1 month ago) (1 child)

    I've used the same one, so let's see how it goes to answer this question:

    Edit: This, of course, doesn’t take buying power into account. So take it with a grain of salt I guess. Or feel free to work it out yourself and post it for the rest of us…

    Based on latest available data for Regional Price Parities (RPP) from 2024, taken from the BEA (Bureau of Economic Analysis) (for the curious, look for SARPP Regional price parities by state), we get the following:

    | | Average | Median | |


    |


    |


    | | Blue | 13.96 | 14.34 | | Red | 9.76 | 8.22 |

    However, it should be noted above info isn't perfect, as I'm using wages from your source for 2025. I'm kinda lazy right now to search for one from 2024

    Convertion based on following formula:

    real wage = nominal wage × (100 ÷ RPP)

    edit: Laziness subsided, found wage data for 2024, which gives:

    | | Average | Median | |


    |


    |


    | | Blue | 13.62 | 14.00 | | Red | 9.47 | 8.22 |

  • source
  • parent
  • hideshow 1 child comment
  • [–] 17 points 1 month ago*

    Under ‘Murican Health care, Tiny Tim’s medical bills would’ve buried the Cratchit’s before the plot even started.

  • source
  • [–] 8 points 1 month ago (3 children)
  • [–] 8 points 1 month ago (2 children)

    https://yt.chocolatemoo53.com/watch?v=ZfZseKmHNwo

    Garys Economics - Know your history

    "In this country, 150 years ago, people were living in desperate poverty. That's going to happen again."

    Always updoot Garys Economics.

  • source
  • parent
  • hideshow 2 child comments