Have been working on my Grafana dashboard recently and am thinking about what else I could add. So far, I have:

  • CPU usage and temperature
  • Memory usage
  • Network usage
  • Backrest daily backup status
  • SMART status of drives
  • CPU and memory usage of containers

Anything else that you find useful? I have a few other ideas, but am curious what others have up. Is everything on one scrollable dashboard, or do you have it organized across multiple?

you are viewing a single comment's thread
view the rest of the comments
[–] 4 points 1 month ago (2 children)

Ng1yNptacZzyuIC.png

usually add a bunch of random stuff, then forget it exists, only to check it half a year later and discover that 75% of prometheus exporters died for some reason

  • source
  • hideshow 2 child comments
  • [–] [S] 2 points 1 month ago (1 child)

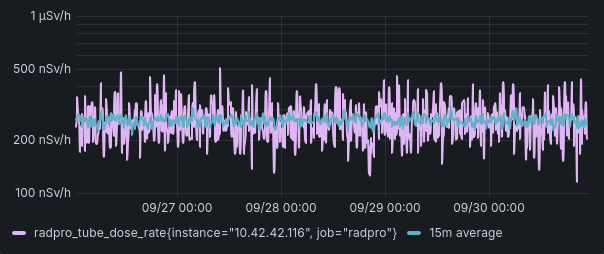
    Haha, that's probably what'll happen to me eventually. I've already noticed a couple data sources missing that I've had to fix. Are you monitoring home radiation?

  • source
  • parent
  • hideshow 1 child comment