This seems like a problem
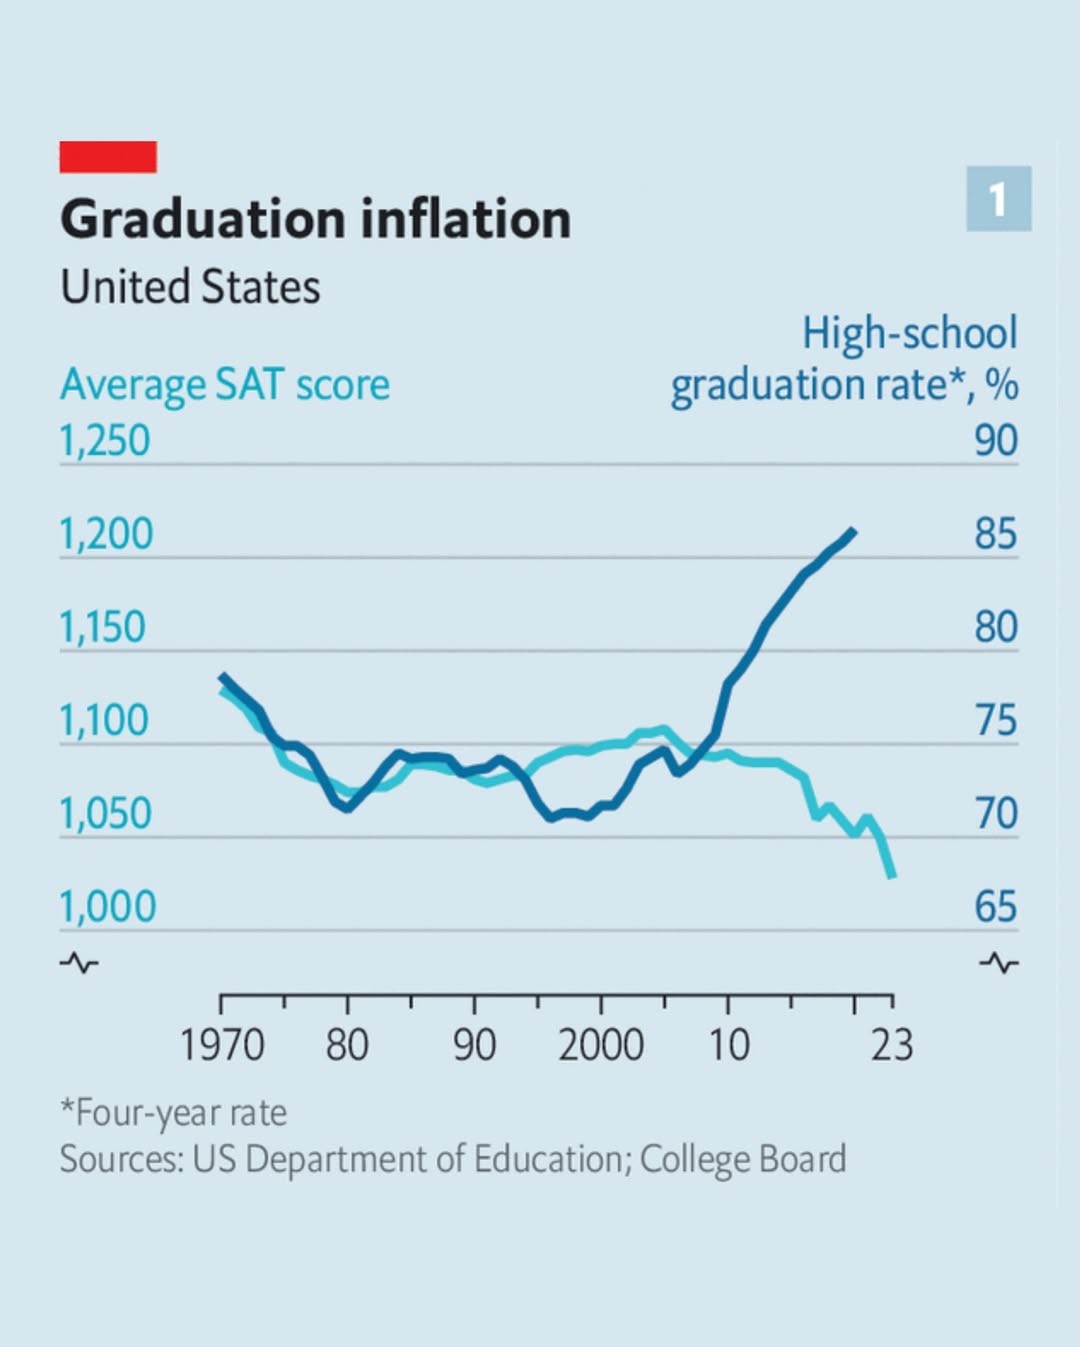
This seems like a problem
How does this chart factor in the decade 2005-2015, when the SAT was scored out of 2400? With prior to 2004 and since 2016 being scored out of 1600.
I knew about the first change, so it's interesting that scores DROPPED while graduations shot up in '05 according to this chart. But I didn't know about the 2016 change and I guess that is the next drop, but not by 800 points which is interesting.