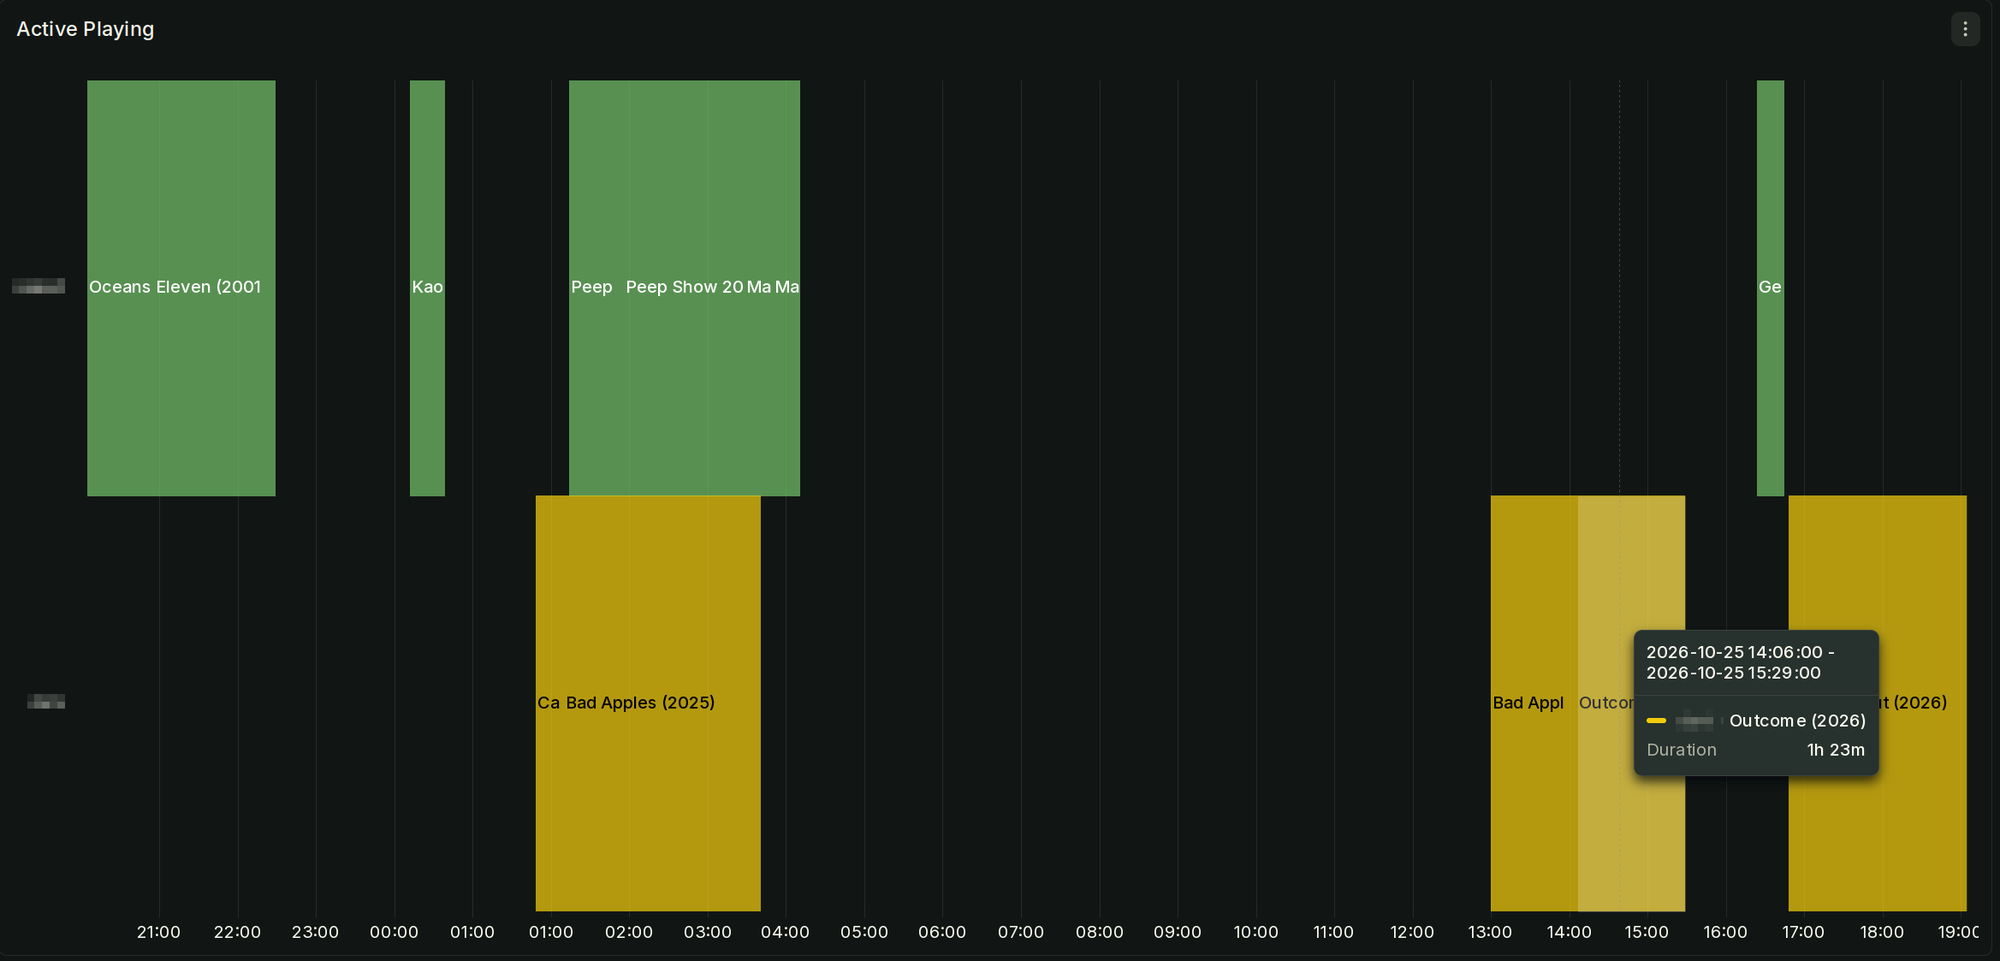
Sorry for the spam but I in fact managed to join the two panels together. y-axis is users and x-axis is timeline of what they watched. Grafana unfortunately does not natively support different colour for each series block.
Sorry for the spam but I in fact managed to join the two panels together. y-axis is users and x-axis is timeline of what they watched. Grafana unfortunately does not natively support different colour for each series block.