Have been working on my Grafana dashboard recently and am thinking about what else I could add. So far, I have:

  • CPU usage and temperature
  • Memory usage
  • Network usage
  • Backrest daily backup status
  • SMART status of drives
  • CPU and memory usage of containers

Anything else that you find useful? I have a few other ideas, but am curious what others have up. Is everything on one scrollable dashboard, or do you have it organized across multiple?

you are viewing a single comment's thread
view the rest of the comments
[–] 2 points 1 week ago (1 child)

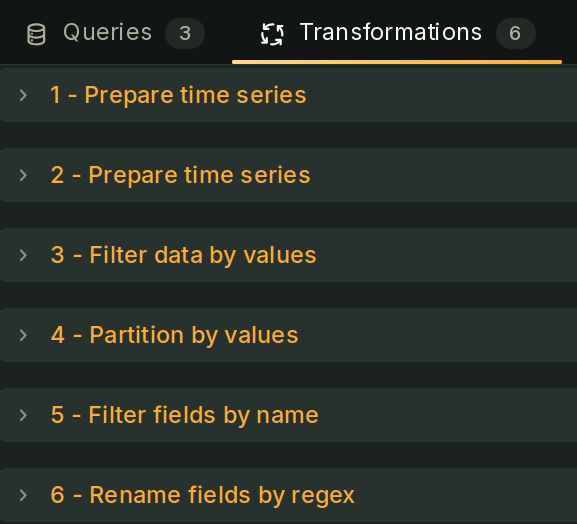
Thanks for asking, it took like 6 transforms. I cannot claim to understand them entirely as they are partly vibecoded but the panel works!
image

  • source
  • parent
  • hideshow 1 child comment