Title text
any questions?
Author comment:
Whoa guys last week’s comic was #1 on r/all! Yus, I’m glad you all liked my Sphynx :D
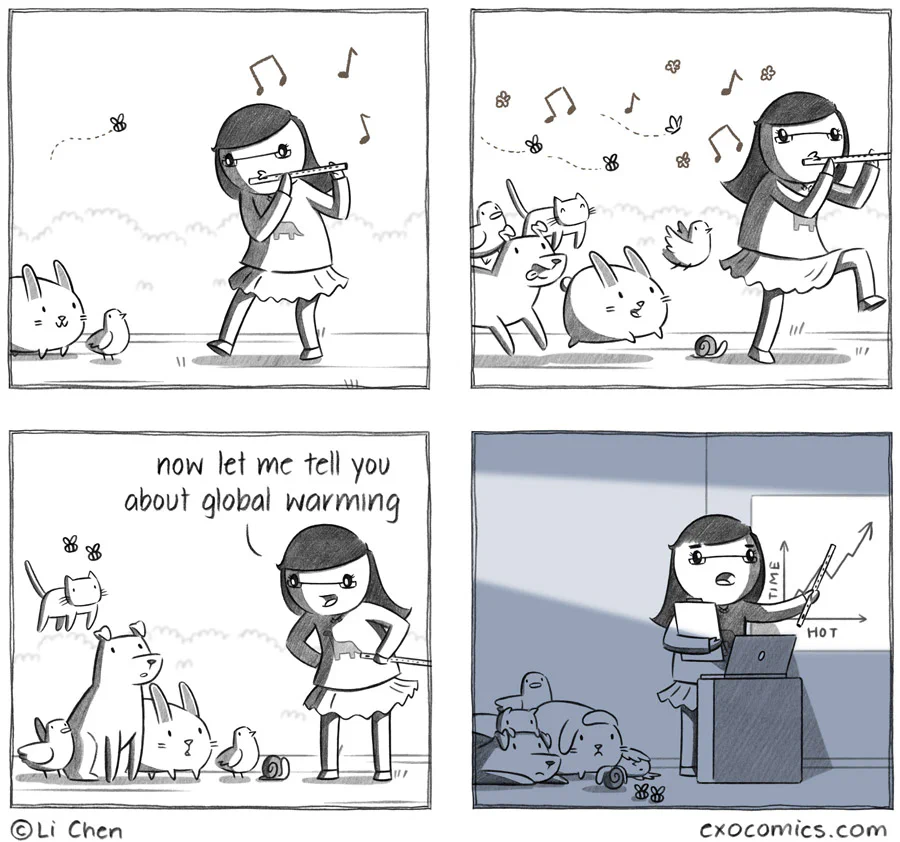
Title text
any questions?
Author comment:
Whoa guys last week’s comic was #1 on r/all! Yus, I’m glad you all liked my Sphynx :D
I thought it would be implied that if you change the axes, then you also change the values accordingly. Typically, the thing you are trying to study goes on the y-axis, and the thing you are using as reference goes on the x-axis. So, if the question was "how does time behave as we change the heat", then the comic graph is the typical arrangement. But the question is (or should be) "how does heat change as we move forward in time".
Again, the graph drawn is technically not wrong. And by flipping the axes, I meant also redrawing the graph to account for the flip. But it bothers me because its against the normal convention of drawing graphs for analysis.