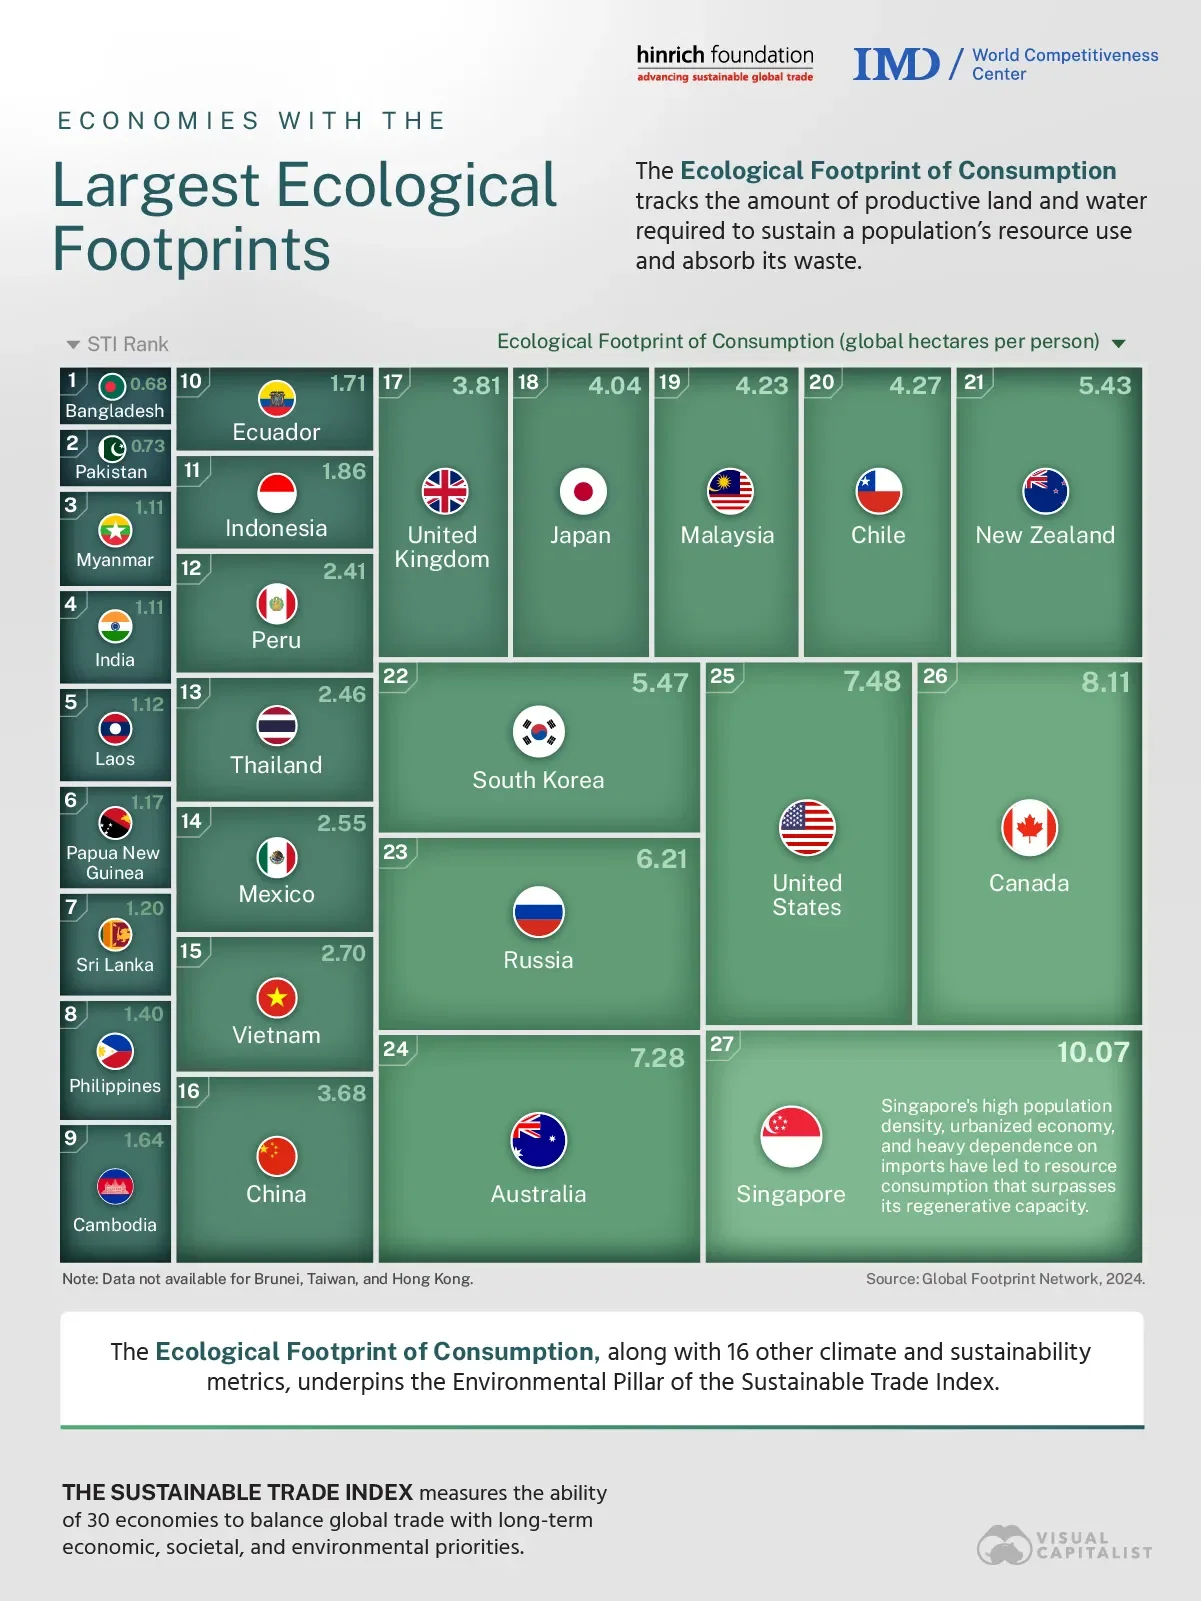
This is a visual representation, right? The numerical ordering is kind of throwing me off.
post
replies:
2 comments in c/dataisbeautiful@lemmy.world view that post
Sorry but this chart is total garbage. The inconsistent proportions make it unclear at a glance whether one box is larger than another. This data is best visualized as a bar graph.
replies:
all 2 comments