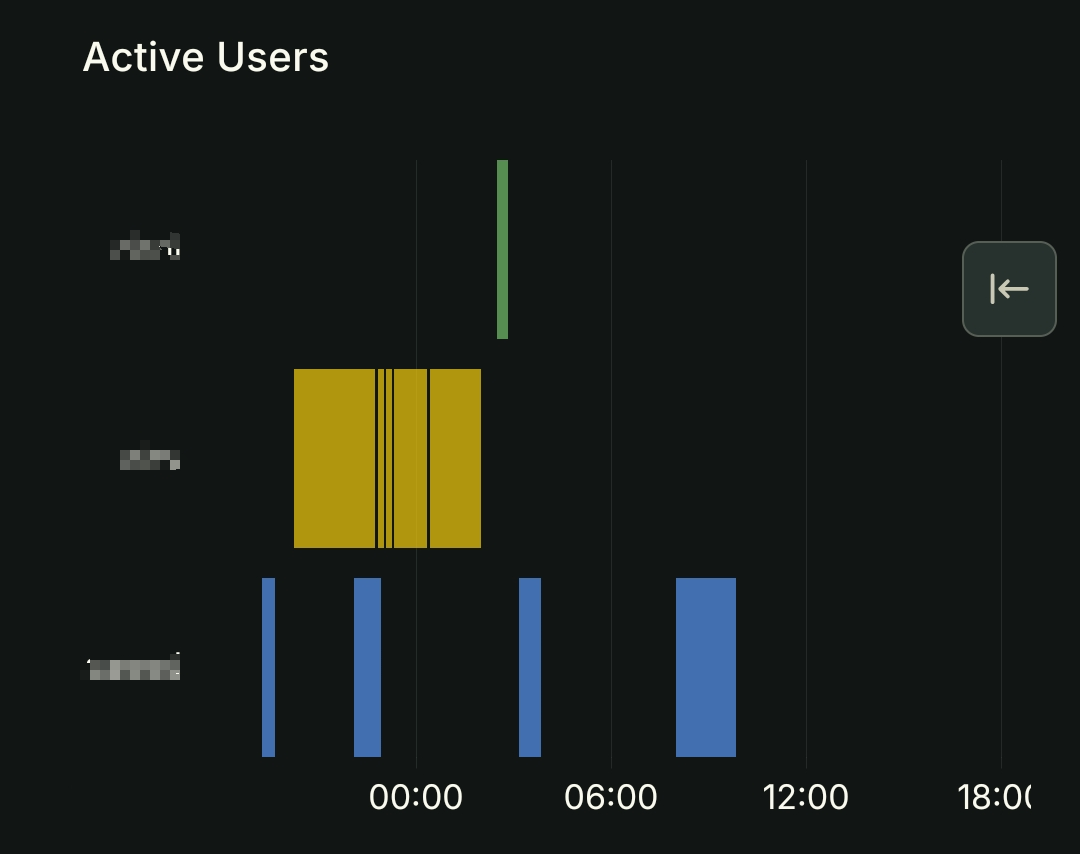
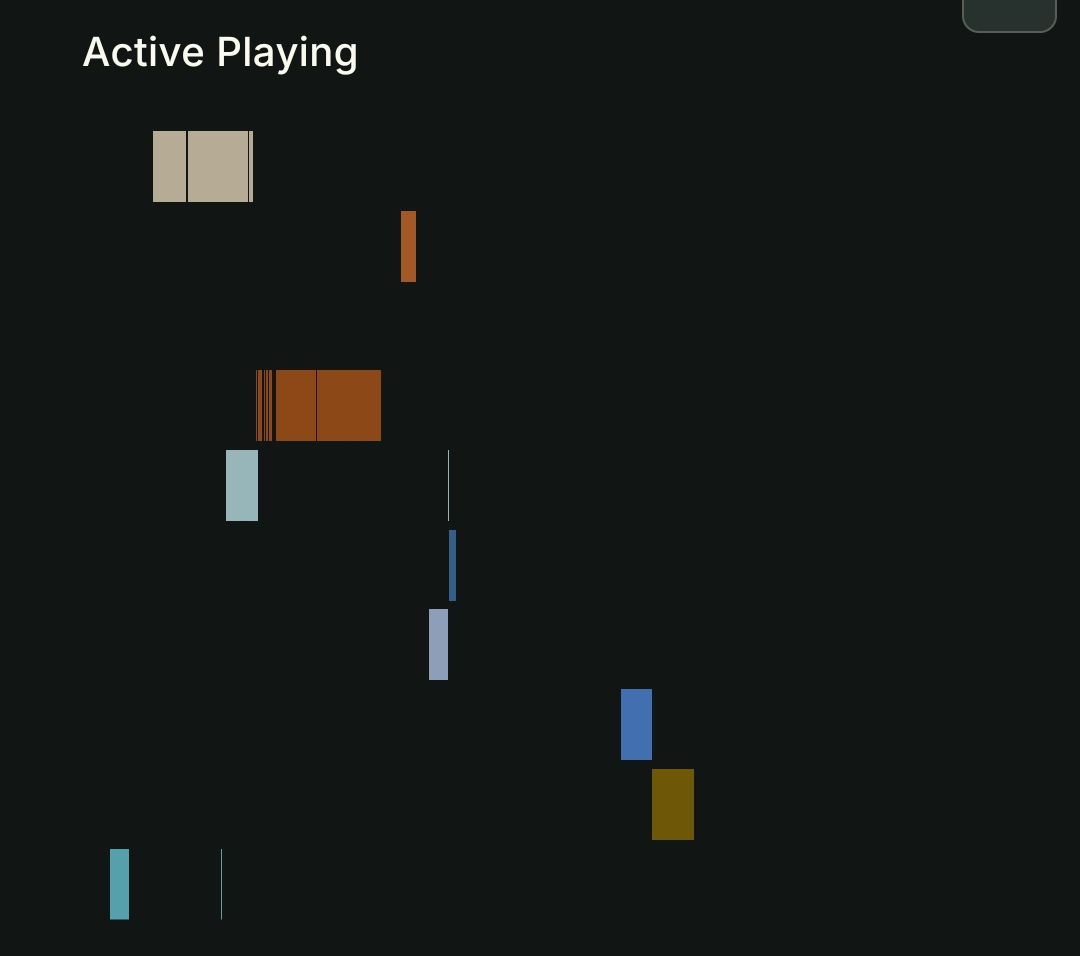
These two are my favourite, first shows active user timeline and second shows active playing timeline (names cut off on mobile). Ideally I would combine them together but have not found a way to do so yet, probably skills issue
These two are my favourite, first shows active user timeline and second shows active playing timeline (names cut off on mobile). Ideally I would combine them together but have not found a way to do so yet, probably skills issue