▲ 179 ▼ Carbon dioxide overload, detected in human blood, suggests a potentially toxic atmosphere within 50 years - Air Quality, Atmosphere & Health (link.springer.com) submitted 8 months ago by mesamunefire@piefed.social to c/science@lemmy.world 27 comments fedilink hide all child comments Anthropogenic activities are increasing the amount of carbon dioxide (CO2) in the atmosphere. There is mounting experimental evidence that lifetime exposur
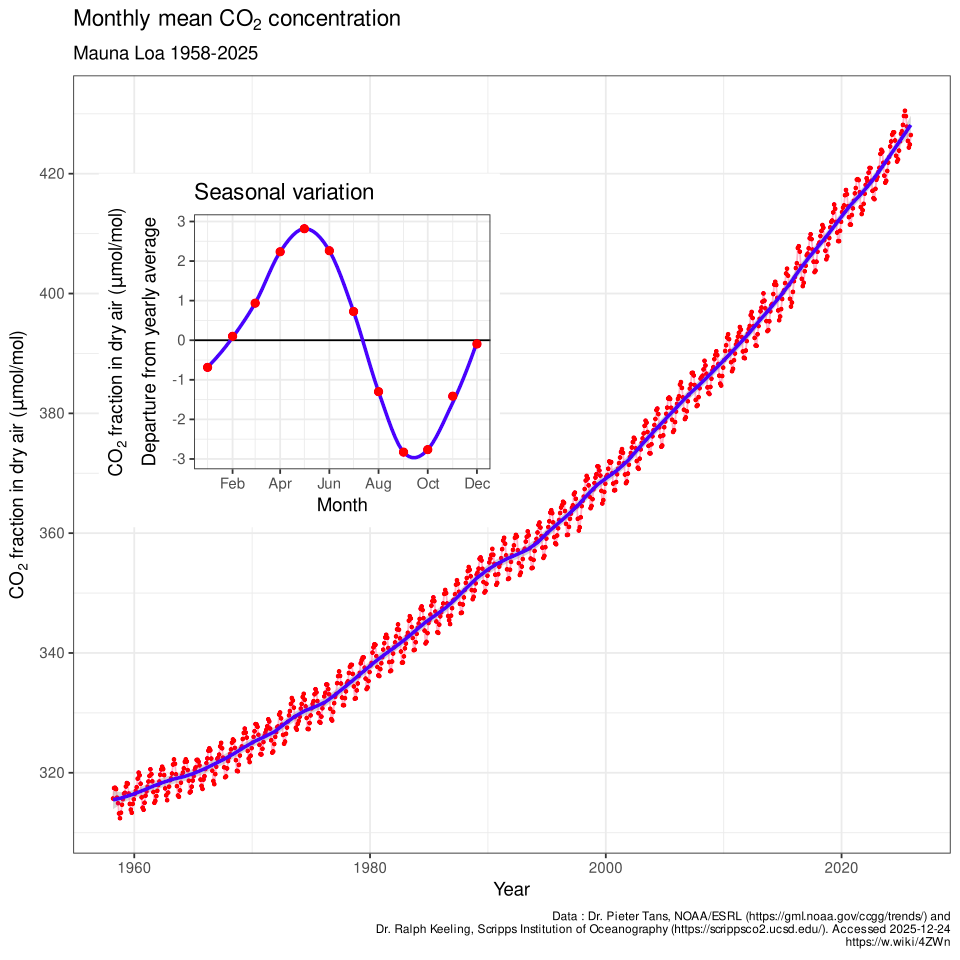
[–] mesamunefire@piefed.social [S] 31 points 8 months ago (7 children) You can see the change here: more general info: https://en.wikipedia.org/wiki/Carbon_dioxide_in_the_atmosphere_of_Earth permalink fedilink source hideshow 7 child comments replies: [–] Kjell@lemmy.world 9 points 8 months ago* (1 child) To make it even more scary, it is accelerating. It has increased 75 ppm in 30 years and it was 40 ppm in the first 30 years. permalink fedilink source parent hideshow 1 child comment replies: [–] Karjalan@lemmy.world 6 points 8 months ago I mean, just the fact that we increased the ppm by ~100, or 1/3rd what it was, in just 60 years is terrifying. Let alone that it's accelerating. And CO2 isn't even the worst climate change gas. And there are many positive feedback loops getting exacerbated by the effects... Good times permalink fedilink source parent [+] Ice@lemmy.zip 2 points 8 months ago (5 children) [deleted] permalink fedilink source parent hideshow 5 child comments replies: [–] fristislurper@piefed.social 5 points 8 months ago (1 child) I see this sentiment quite often, is it field-specific? Cause in physics and chemistry, starting at 0 is really not required... In this case, the zero value is really not relevant (since no-one would ever have it anyway). It would just hide the signifcant drift over time. A good scaling here would be based on some clinically relevant interval I guess. permalink fedilink source parent hideshow 1 child comment replies: [–] matsdis@piefed.social 1 point 8 months ago* (last edited 8 months ago) I agree that showing the zero level may be useful here, but... I cannot find a scientific source that shows it differently, so it's not intentionally misleading at least. The bigger issue IMO is that it doesn't show enough historic context (ice core data). The original article has it, or nature.org or co2science.org (though it doesn't show the latest measurements). permalink fedilink source parent [–] mesamunefire@piefed.social [S] 4 points 8 months ago This graph is from wikipedia. Feel free to fix it. permalink fedilink source parent [–] Lemming6969@lemmy.world 1 point 8 months ago (1 child) Isn't this the opposite of truncated? They drill down each year's cycle and show like 80 years of cycles. permalink fedilink source parent hideshow 1 child comment replies: [–] hikaru755@lemmy.world 3 points 8 months ago The y axis doesn't start at 0, making it look like the change has been a lot more drastic than it actually was (even though it's still very bad). I think that's what they're referring to permalink fedilink source parent load more comments (-1 replies)
[–] Kjell@lemmy.world 9 points 8 months ago* (1 child) To make it even more scary, it is accelerating. It has increased 75 ppm in 30 years and it was 40 ppm in the first 30 years. permalink fedilink source parent hideshow 1 child comment replies: [–] Karjalan@lemmy.world 6 points 8 months ago I mean, just the fact that we increased the ppm by ~100, or 1/3rd what it was, in just 60 years is terrifying. Let alone that it's accelerating. And CO2 isn't even the worst climate change gas. And there are many positive feedback loops getting exacerbated by the effects... Good times permalink fedilink source parent
[–] Karjalan@lemmy.world 6 points 8 months ago I mean, just the fact that we increased the ppm by ~100, or 1/3rd what it was, in just 60 years is terrifying. Let alone that it's accelerating. And CO2 isn't even the worst climate change gas. And there are many positive feedback loops getting exacerbated by the effects... Good times permalink fedilink source parent
[+] Ice@lemmy.zip 2 points 8 months ago (5 children) [deleted] permalink fedilink source parent hideshow 5 child comments replies: [–] fristislurper@piefed.social 5 points 8 months ago (1 child) I see this sentiment quite often, is it field-specific? Cause in physics and chemistry, starting at 0 is really not required... In this case, the zero value is really not relevant (since no-one would ever have it anyway). It would just hide the signifcant drift over time. A good scaling here would be based on some clinically relevant interval I guess. permalink fedilink source parent hideshow 1 child comment replies: [–] matsdis@piefed.social 1 point 8 months ago* (last edited 8 months ago) I agree that showing the zero level may be useful here, but... I cannot find a scientific source that shows it differently, so it's not intentionally misleading at least. The bigger issue IMO is that it doesn't show enough historic context (ice core data). The original article has it, or nature.org or co2science.org (though it doesn't show the latest measurements). permalink fedilink source parent [–] mesamunefire@piefed.social [S] 4 points 8 months ago This graph is from wikipedia. Feel free to fix it. permalink fedilink source parent [–] Lemming6969@lemmy.world 1 point 8 months ago (1 child) Isn't this the opposite of truncated? They drill down each year's cycle and show like 80 years of cycles. permalink fedilink source parent hideshow 1 child comment replies: [–] hikaru755@lemmy.world 3 points 8 months ago The y axis doesn't start at 0, making it look like the change has been a lot more drastic than it actually was (even though it's still very bad). I think that's what they're referring to permalink fedilink source parent
[–] fristislurper@piefed.social 5 points 8 months ago (1 child) I see this sentiment quite often, is it field-specific? Cause in physics and chemistry, starting at 0 is really not required... In this case, the zero value is really not relevant (since no-one would ever have it anyway). It would just hide the signifcant drift over time. A good scaling here would be based on some clinically relevant interval I guess. permalink fedilink source parent hideshow 1 child comment replies: [–] matsdis@piefed.social 1 point 8 months ago* (last edited 8 months ago) I agree that showing the zero level may be useful here, but... I cannot find a scientific source that shows it differently, so it's not intentionally misleading at least. The bigger issue IMO is that it doesn't show enough historic context (ice core data). The original article has it, or nature.org or co2science.org (though it doesn't show the latest measurements). permalink fedilink source parent
[–] matsdis@piefed.social 1 point 8 months ago* (last edited 8 months ago) I agree that showing the zero level may be useful here, but... I cannot find a scientific source that shows it differently, so it's not intentionally misleading at least. The bigger issue IMO is that it doesn't show enough historic context (ice core data). The original article has it, or nature.org or co2science.org (though it doesn't show the latest measurements). permalink fedilink source parent
[–] mesamunefire@piefed.social [S] 4 points 8 months ago This graph is from wikipedia. Feel free to fix it. permalink fedilink source parent
[–] Lemming6969@lemmy.world 1 point 8 months ago (1 child) Isn't this the opposite of truncated? They drill down each year's cycle and show like 80 years of cycles. permalink fedilink source parent hideshow 1 child comment replies: [–] hikaru755@lemmy.world 3 points 8 months ago The y axis doesn't start at 0, making it look like the change has been a lot more drastic than it actually was (even though it's still very bad). I think that's what they're referring to permalink fedilink source parent
[–] hikaru755@lemmy.world 3 points 8 months ago The y axis doesn't start at 0, making it look like the change has been a lot more drastic than it actually was (even though it's still very bad). I think that's what they're referring to permalink fedilink source parent