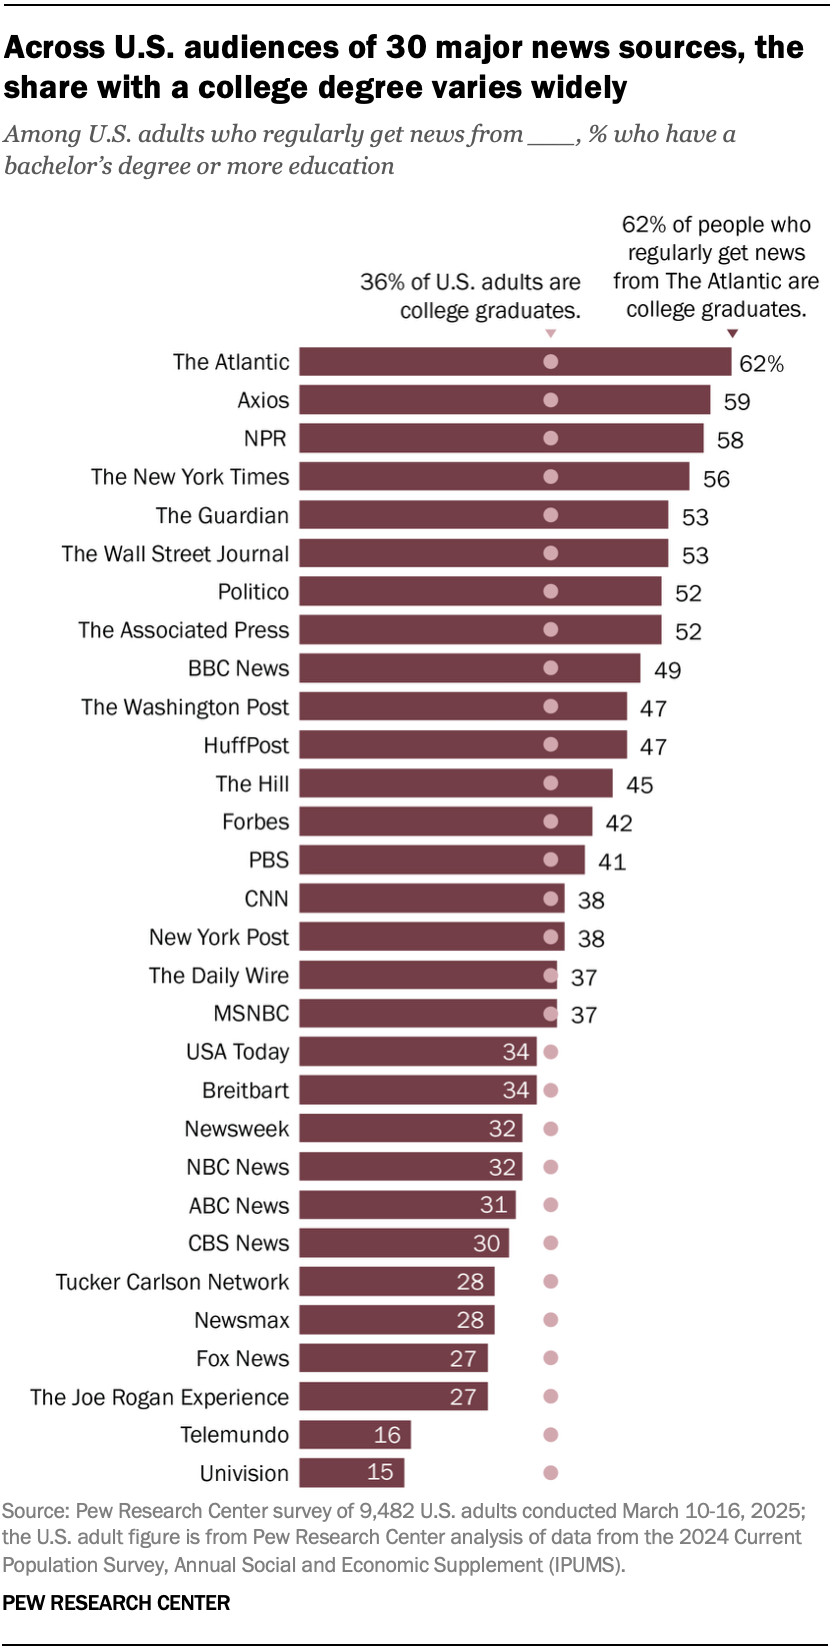
▲ 249 ▼ How the audiences of news sources differ in their levels of education (www.pewresearch.org) submitted 9 months ago by Ondore@lemmy.world to c/mildlyinteresting@lemmy.world 70 comments fedilink hide all child comments Source: Pew Research Center
[–] Sergio@piefed.social 5 points 9 months ago (5 children) Kind of a weird graph.... the "percentage of US adults who has a college degree" is on a scale of all US adults the "percentage of US adults who get their news from a given source" is on a scale of all US adults with college degrees But they're shown on the same bar graph, which implies they're shown on the same scale. Right? or am I misreading this? permalink fedilink source hideshow 5 child comments replies: [–] hesh 9 points 9 months ago* (2 children) It's not "what % of college graduates get their news from this source", it's "what % of adults that get their news from this source have a college degree" permalink fedilink source parent hideshow 2 child comments replies: [–] Sergio@piefed.social 0 points 9 months ago (1 child) OK you're right. the scales are: on a scale of all US adults, the percentage who have a college degree on a scale of all readers who primarily get their news from (given magazine), the percentage who have a college degree So the scales are still different. I'm guessing they'd make an argument that: "If the college graduate readership were distributed evenly across all news sources, then (given magazine) would have (the percentage of all US adults who have a college degree)." But the labels don't say that, which is why it is confusing. permalink fedilink source parent hideshow 1 child comment replies: [–] hesh 5 points 9 months ago* (last edited 9 months ago) Imagine "All Americans" as one of the bars like the others - its just another cohort. permalink fedilink source parent [+] U7826391786239@lemmy.zip 4 points 9 months ago (1 child) [deleted] permalink fedilink source parent hideshow 1 child comment replies: [–] Sergio@piefed.social 1 point 9 months ago OK you're right. the scales are: on a scale of all US adults, the percentage who have a college degree on a scale of all readers who primarily get their news from (given magazine), the percentage who have a college degree So the scales are still different. I'm guessing they'd make an argument that: "If the college graduate readership were distributed evenly across all news sources, then (given magazine) would have (the percentage of all US adults who have a college degree)." But the labels don't say that, which is why it is confusing. permalink fedilink source parent
[–] hesh 9 points 9 months ago* (2 children) It's not "what % of college graduates get their news from this source", it's "what % of adults that get their news from this source have a college degree" permalink fedilink source parent hideshow 2 child comments replies: [–] Sergio@piefed.social 0 points 9 months ago (1 child) OK you're right. the scales are: on a scale of all US adults, the percentage who have a college degree on a scale of all readers who primarily get their news from (given magazine), the percentage who have a college degree So the scales are still different. I'm guessing they'd make an argument that: "If the college graduate readership were distributed evenly across all news sources, then (given magazine) would have (the percentage of all US adults who have a college degree)." But the labels don't say that, which is why it is confusing. permalink fedilink source parent hideshow 1 child comment replies: [–] hesh 5 points 9 months ago* (last edited 9 months ago) Imagine "All Americans" as one of the bars like the others - its just another cohort. permalink fedilink source parent
[–] Sergio@piefed.social 0 points 9 months ago (1 child) OK you're right. the scales are: on a scale of all US adults, the percentage who have a college degree on a scale of all readers who primarily get their news from (given magazine), the percentage who have a college degree So the scales are still different. I'm guessing they'd make an argument that: "If the college graduate readership were distributed evenly across all news sources, then (given magazine) would have (the percentage of all US adults who have a college degree)." But the labels don't say that, which is why it is confusing. permalink fedilink source parent hideshow 1 child comment replies: [–] hesh 5 points 9 months ago* (last edited 9 months ago) Imagine "All Americans" as one of the bars like the others - its just another cohort. permalink fedilink source parent
[–] hesh 5 points 9 months ago* (last edited 9 months ago) Imagine "All Americans" as one of the bars like the others - its just another cohort. permalink fedilink source parent
[+] U7826391786239@lemmy.zip 4 points 9 months ago (1 child) [deleted] permalink fedilink source parent hideshow 1 child comment replies: [–] Sergio@piefed.social 1 point 9 months ago OK you're right. the scales are: on a scale of all US adults, the percentage who have a college degree on a scale of all readers who primarily get their news from (given magazine), the percentage who have a college degree So the scales are still different. I'm guessing they'd make an argument that: "If the college graduate readership were distributed evenly across all news sources, then (given magazine) would have (the percentage of all US adults who have a college degree)." But the labels don't say that, which is why it is confusing. permalink fedilink source parent
[–] Sergio@piefed.social 1 point 9 months ago OK you're right. the scales are: on a scale of all US adults, the percentage who have a college degree on a scale of all readers who primarily get their news from (given magazine), the percentage who have a college degree So the scales are still different. I'm guessing they'd make an argument that: "If the college graduate readership were distributed evenly across all news sources, then (given magazine) would have (the percentage of all US adults who have a college degree)." But the labels don't say that, which is why it is confusing. permalink fedilink source parent