I'm caching less to keep the load off piefed, and more to keep the load off our network connection and improve performance for users. Unfortunately nginx won't help with that. Also though I know it's trivial to get our origin IP if you're determined, it helps avoid the casual ddos attacks.
comments
You might be able to get away with not having any CDN on PieFed at all - https://join.piefed.social/2025/11/22/reducing-piefeds-dependence-on-cloudflare/
A few weeks back I went through and made sure the Cache-Control headers are being set right so nginx can do a good job of caching.
Nice job! I just moved my hosting to stormweb.ca and I'm super happy about the switch.
[deleted]
Good call. Thank you.
Beautiful
And if I'm behind NAT everyone who is behind it counts as one.
You're not wrong. Today's data is from 12:20, all other days are from around 14 central European time.
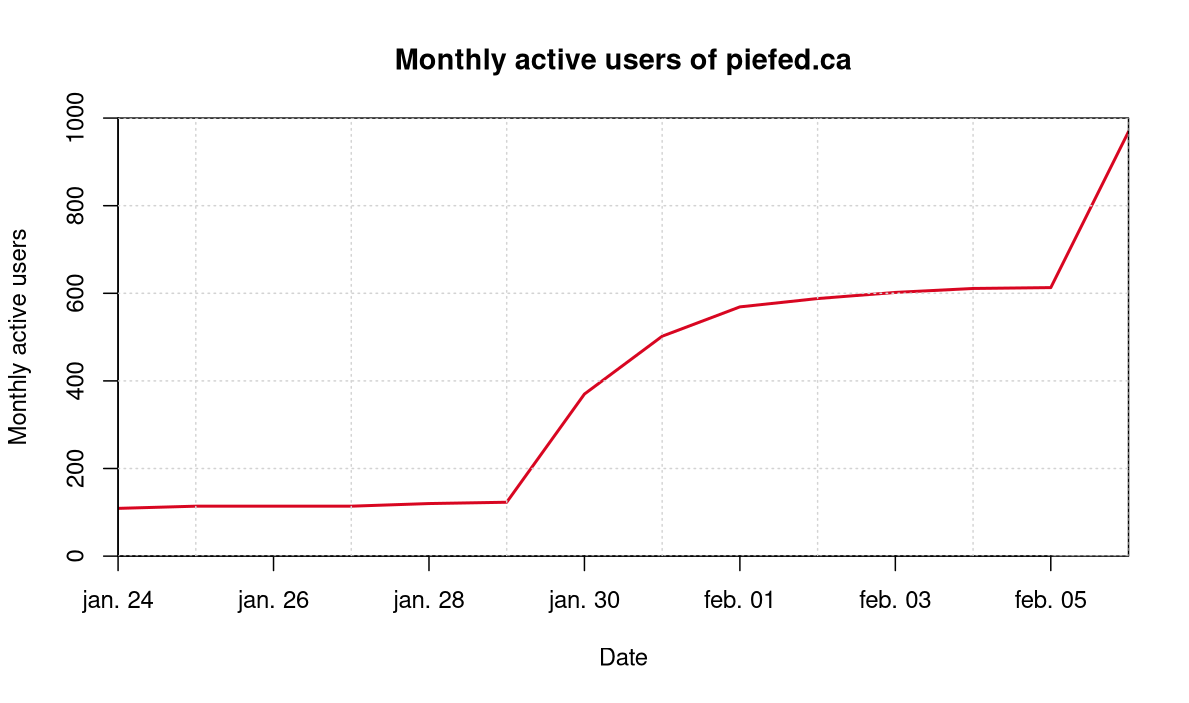
mau <- c(109, 114, 114, 114, 120, 123, 370, 502, 569, 588, 602, 611, 613, 969)
Date <- as.Date(as.Date("2026-01-24"):as.Date("2026-02-06"))
plot(Date, mau, type="l", ylab="Monthly active users", lwd="2", main="Monthly active users of piefed.ca",
     col="#D80621", xaxs="i", yaxs="i", ylim=c(0,1000))
grid()
comment on
New post on r/BuyCanadian Promoting PieFed.ca and showing off the growth we've seen here.
I made both those posts, I thought they were different enough to not breach rule 7
They were 7 days apart, and the 2nd post was the graph about the growth we've seen, not just a copy past post. But yea fair, I'll give it a month before posting again.
comment on
New post on r/BuyCanadian Promoting PieFed.ca and showing off the growth we've seen here.
To be fair, someone else did post about it last week and they had rules about that.
I love having new people here, but I also don't want newcomers to feel spammed. Nor give Reddit any justification for going back to auto removing any discussion of Reddit alternatives.
I haven't, thanks for the suggestion. They're American though, but seems to be a reasonable company otherwise.
comment on
New post on r/BuyCanadian Promoting PieFed.ca and showing off the growth we've seen here.
 What a surprise
comment on
New post on r/BuyCanadian Promoting PieFed.ca and showing off the growth we've seen here.
Thanks 😄, I tried to help out the best I could
It’s not self promotion if I do it!
… but I don’t have a Reddit account
comment on
New post on r/BuyCanadian Promoting PieFed.ca and showing off the growth we've seen here.
@otter@lemmy.ca you are so good at outreach!
comment on
Welcome new users to piefed.ca and lemmy.ca!
Thank you! I will try it!
have you looked at ngrok?
Lol I noticed that too, but it just seems to be the captcha.
Thanks for all the hard work! I totally don't understand hosting/managing the community I bet it's a huge task. Thank you!
comment on
Welcome new users to piefed.ca and lemmy.ca!
You can use Mlem instead written in Swift.
Why don't you post it for them?
comment on
Welcome new users to piefed.ca and lemmy.ca!
Is there an iOS version?
Amazing thanks, only seeing this now. I've already made a post and it seems to be blowing up.
Here's the number of monthly active users, which might look more impressive to people who obsess over the Y axis:
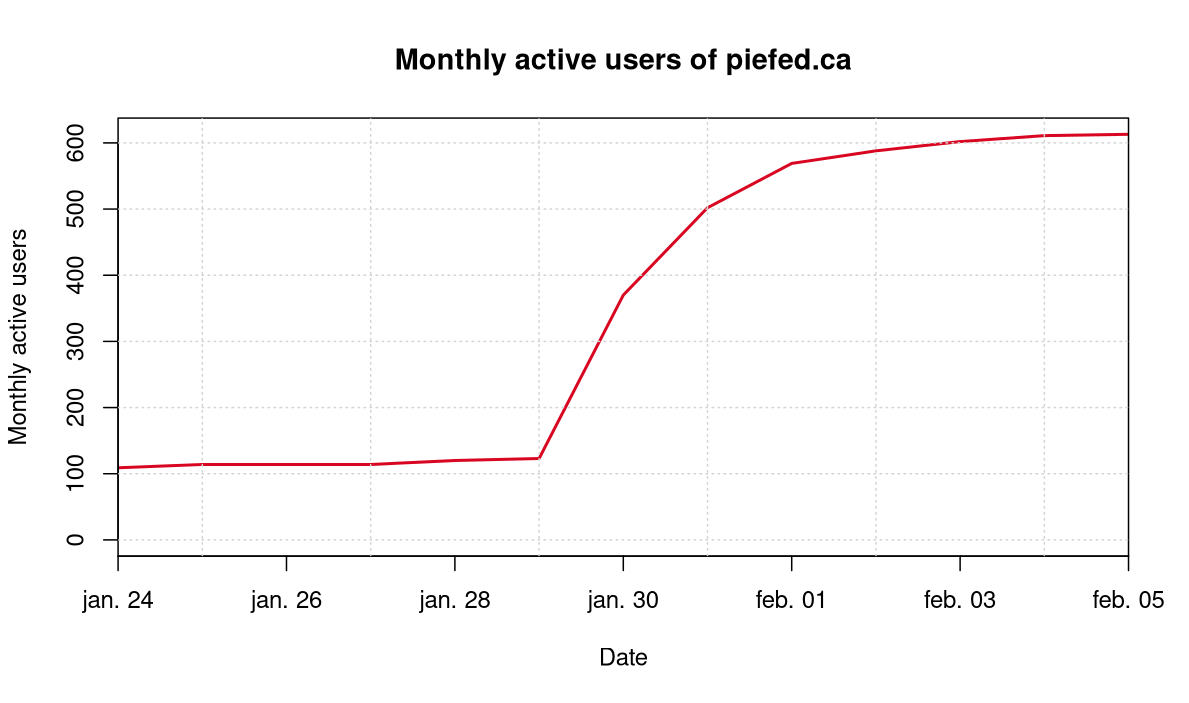
It's not super pretty as I just threw it together and really should be doing other things. But it's colour matching the Canadian flag, which I hope is appreciated. :)
I guess a key takeaway is that the number of active users at Piefed.ca multiplied by more than five since late January.
mau <- c(109, 114, 114, 114, 120, 123, 370, 502, 569, 588, 602, 611, 613)
Date <- as.Date(as.Date("2026-01-24"):as.Date("2026-02-05"))
plot(Date, mau, type="l", ylab="Monthly active users", lwd="2", main="Monthly active users of piefed.ca",
     col="#D80621", xaxs="i", ylim=c(0,613))
grid()
As a European (but who lived for 10 years in Montreal, that's why I have an account here) I applaud any initiative to move digital infrastructure away from the US. Good luck.