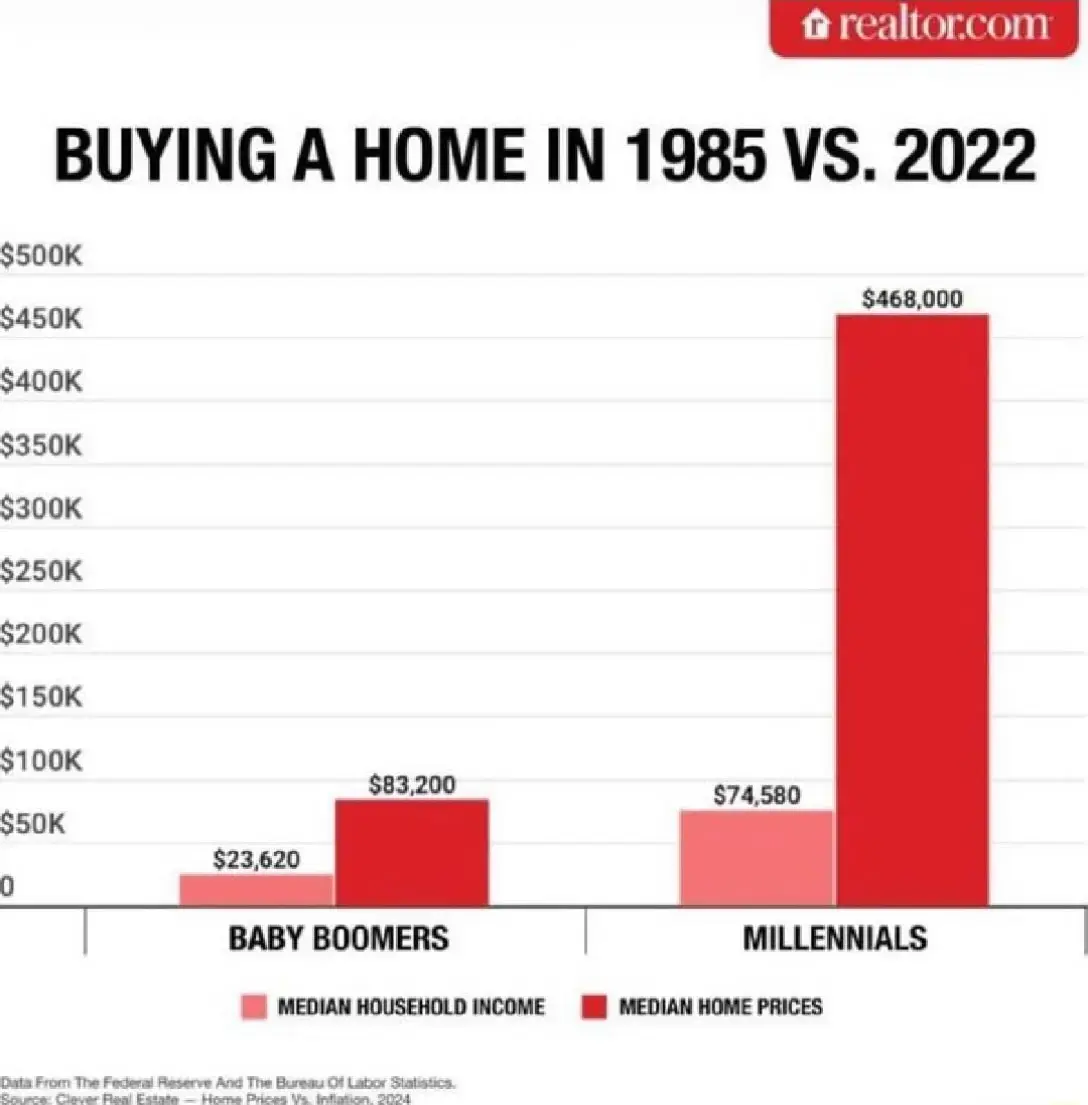
I haven't seen the housing affordability generational difference contrasted so plainly and clearly as in this simple bar chart
(assets.bne.social)
I haven't seen the housing affordability generational difference contrasted so plainly and clearly as in this simple bar chart.They're using US data here too so in Australia that 2nd red bar would be quite a bit taller. But yeah sure tell us again how we're just not budgeting hard enough. 🙃 40+ years of continually worsening inequality and decreased living standards due to line-go-up acceleration of asset prices. #Housing is a human right, not a speculative investment. Maybe about time we do something to reverse this trend hey?